
August 2026
ioki Operator
New ioki Operator design
We have fundamentally redesigned the ioki Operator interface based on your feedback. The result is faster, more intuitive, and gives significantly more clarity for what really matters in day-to-day operations.
New Setup page with favorites
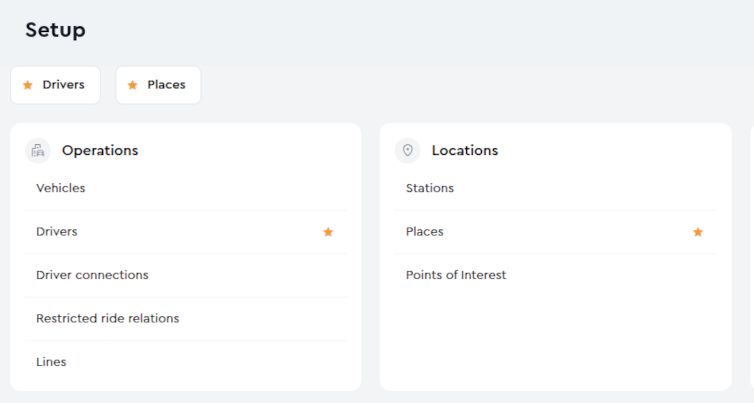
All settings are now grouped together on a central overview page instead of being spread across nested menus. Areas you use regularly, such as Drivers, Passenger options, or Dispatch configuration, can be marked as favorites with the star icon. Your favorites appear directly at the top of the Setup page and can be reached with a single click.
Faster product switching
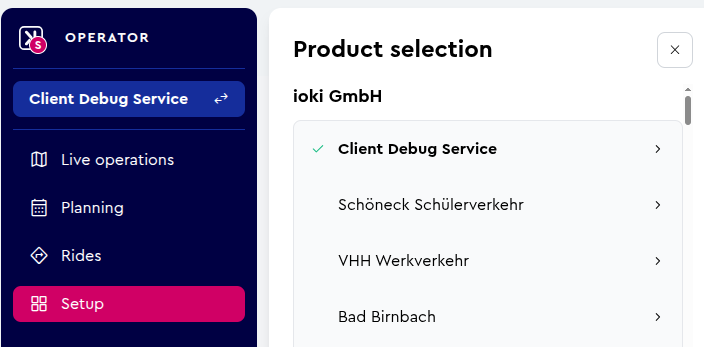
If you manage multiple products or instances, you can now switch between them directly in the interface, without logging in again, using separate tabs, or taking detours. This lets you move between different services or locations more quickly and saves time in day-to-day operations.
Central access to all ioki apps
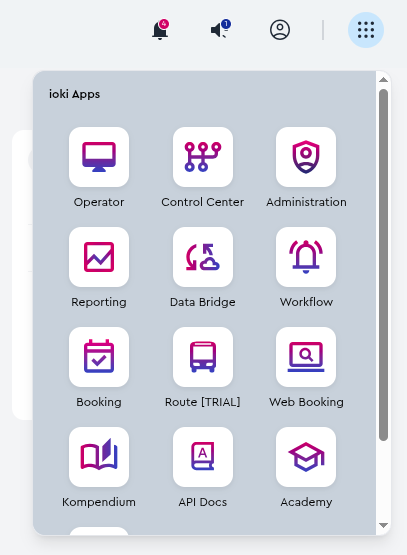
The new App Switcher provides central access to all important ioki applications, including Operator, Control Center, ioki Reporting, ioki Route, Data Bridge, ioki Workflow, Web Booking Control, Compendium, API Documentation, and ioki Academy. You can switch between the tools you need with a single click.
More space for the map and planning overview
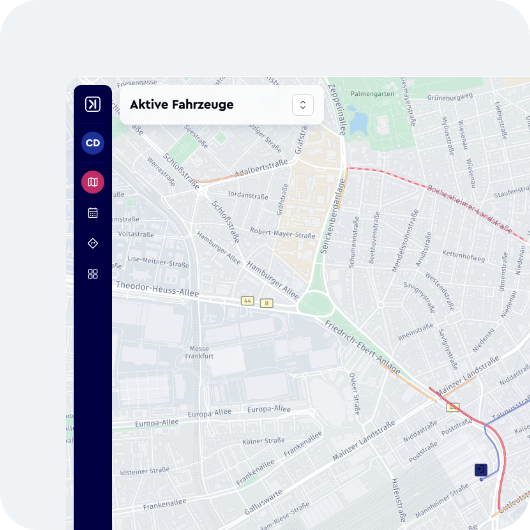
The map view and planning overview now take up significantly more screen space than before. Fewer unnecessary borders and elements create more visible space for operational activities. Especially when many vehicles are active at the same time or several alerts need to be monitored, more information is visible at once.
Larger detail views with integrated map
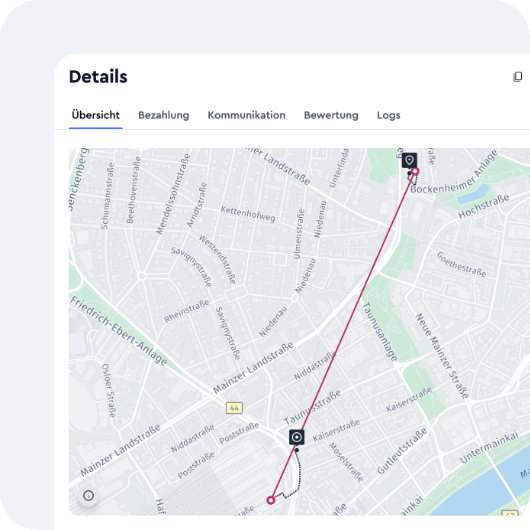
The detail views for rides, vehicles, and shifts are now wider and display the route or position directly within the view. All relevant information about a ride or vehicle is visible at a glance, without switching between the list view and a separate map view.
Result
The entire interface has been visually redesigned: a clearer structure, consistent typography, and a clean appearance make it easier to find your way around and navigate the Operator. Day-to-day work in the control center becomes clearer and more efficient.
ioki Reporting
Design and structure update
The ioki Reporting interface has been updated in several areas. Navigation is now clearer, reports are more structured, and important information such as news and FAQs is easier to access.
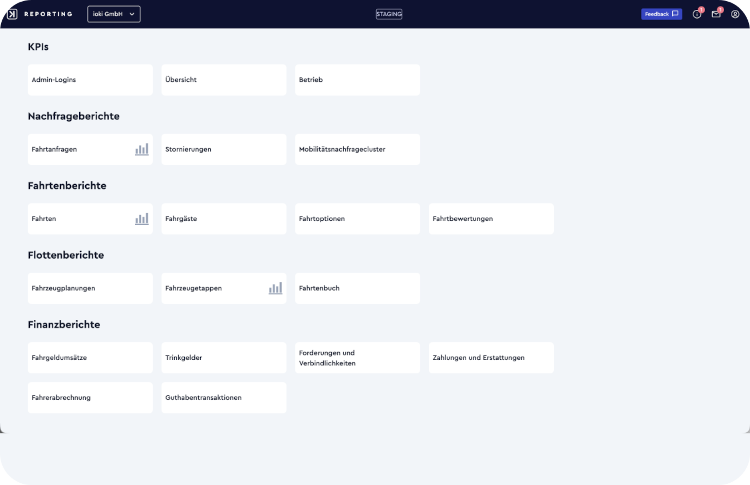
New tile navigation and clear report structure
The previous side navigation has been replaced by a tile-based navigation. It gives a better overview of the available reports, creates more space for reports and charts, and is more convenient to use on tablet devices. At the same time, operational reports are now more clearly structured and grouped into three areas: Demand reports for ride requests and cancellations, Rides reports for completed rides and related metrics, and Fleet reports for vehicle- and vehicle-planning-related analyses.
News and FAQ directly in the header
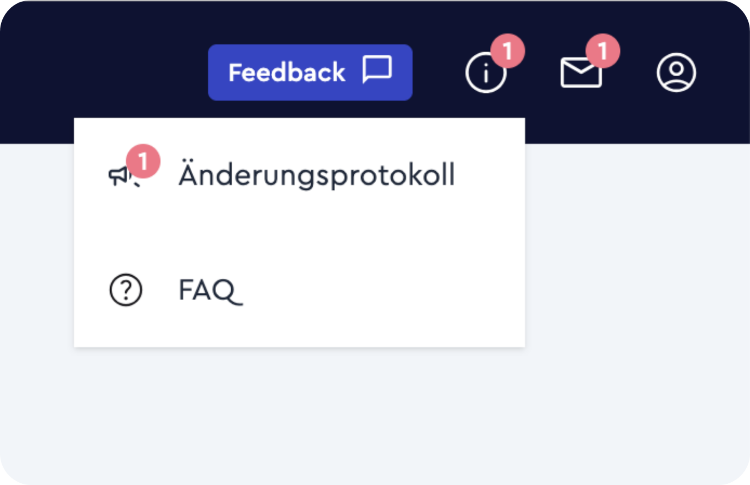
News and FAQ are now linked directly in the header and can be reached from anywhere in the application. News is presented in a changelog style and provides information about recent changes. A red badge indicates when new updates are available.
The Refresh all data function has been removed, as data is already updated automatically through the regular report refresh. This also applies to changed user permissions—no manual refresh is required anymore.
Result
The new navigation and structure make it easier to get started with the different reports and provide a clearer, more intuitive experience in ioki Reporting.
New charts for capacity and utilization
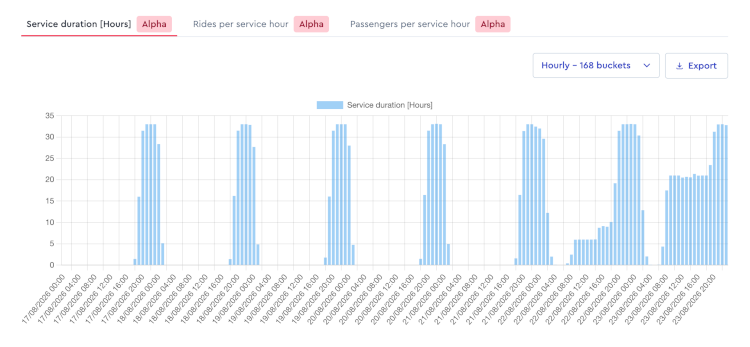
Three new charts are now available in ioki Reporting. They show the offered capacity and the utilization of the service, helping you better understand patterns throughout the day and track how the service develops over longer periods.
Service duration (gross) [hours]
The chart shows the time from the actual shift start to the shift end, minus pauses. It gives the best view of how much vehicle capacity was actually out in service. Service duration is an important basis for other metrics such as completed rides, no offers, and accepted bookings, and serves as a good indicator of the service costs incurred.
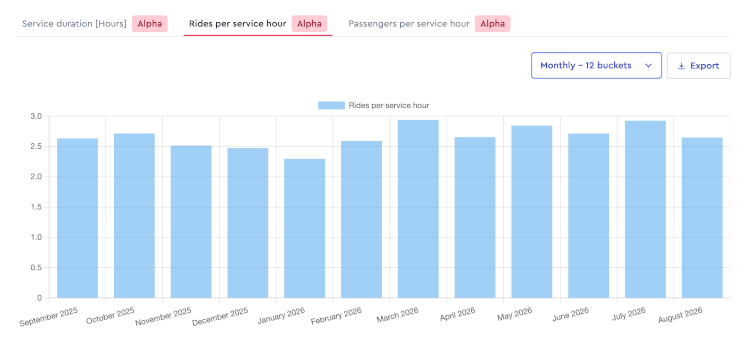
Rides per service hour
The chart shows how many rides your vehicles picked up for every hour they are in service. This lets you see at a glance how efficiently the available vehicle capacity is being used and whether adjusting capacity could be beneficial.
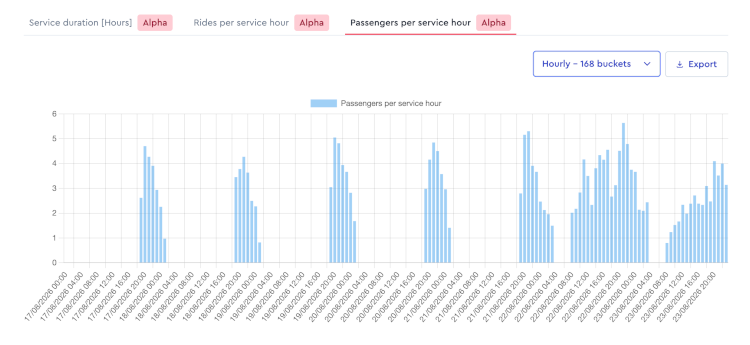
Passengers per service hour
Utilization is also shown based on passengers per service hour. This metric shows how many passengers your vehicles transport on average for every hour they are in service. Together with rides per service hour, it gives a better view of the efficiency of the service.
Gross vs. net service duration
With the new charts, ioki Reporting introduces a distinction between gross and net service duration for the first time. The known net service duration corresponds to the actual shift start to the shift end, minus pauses and deactivations. The new gross service duration only deducts pauses; deactivations are not subtracted.
This distinction is necessary because the Vehicle Legs report cannot factor in deactivations. The new capacity chart therefore uses the gross figure. Net service duration remains unchanged and continues to be shown wherever it was displayed before.
Flexible analysis
All three charts are available at an hourly level. This makes it possible to identify daily patterns and peak times, for example. For longer-term analyses, the values can also be aggregated over larger periods to track how the service develops over time.
Since rides per service hour and passengers per service hour are now available as charts, the corresponding KPI tiles have been removed from the Vehicle Planning report. This avoids displaying the same metric twice.
Result
The new charts show how much capacity was in service and how efficiently it was used. This makes it easier to assess utilization and capacity requirements and to understand developments throughout the day or over longer periods.