
June 2025
Operational reports
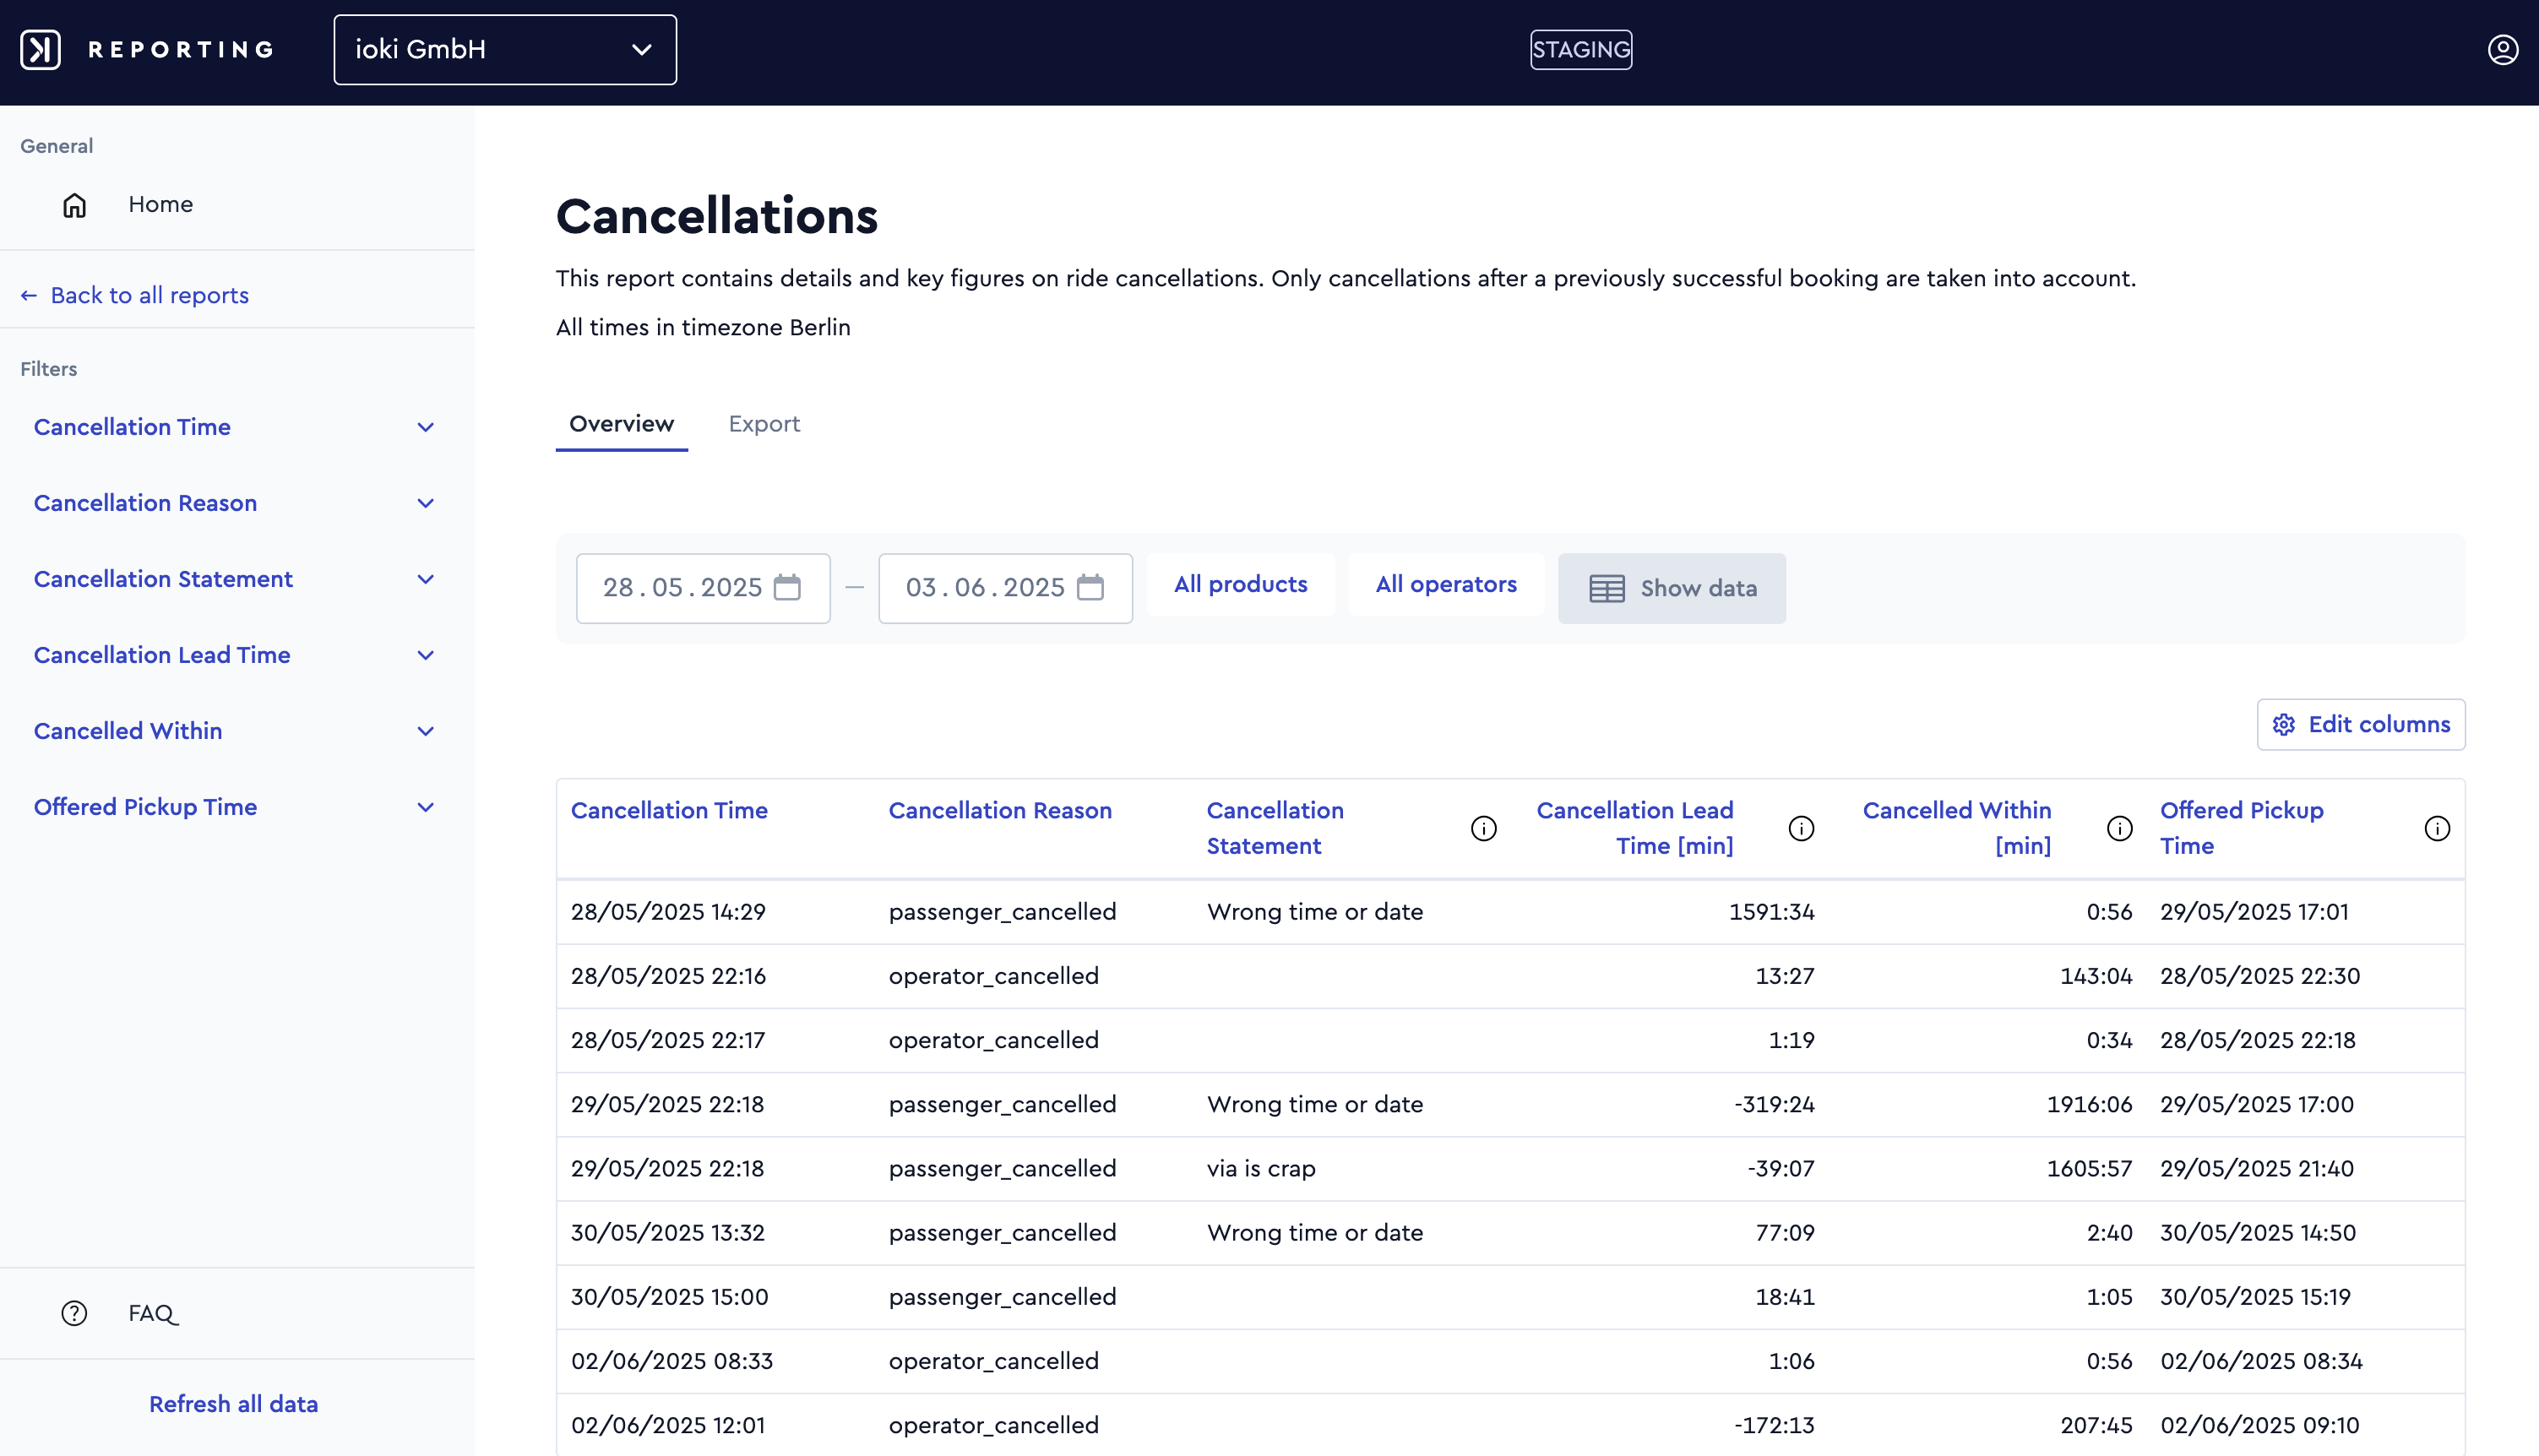
Cancellations
The Cancellation Report provides key figures and detailed insights into ride cancellations. It shows who canceled which bookings and the reasons given. To support more targeted analysis, filters allow users to exclude immediate cancellations—often caused by booking errors—or to focus specifically on last-minute cancellations occurring shortly before the scheduled pickup time. A wide range of parameters is available and can be added or removed using the Edit columns option to customize or streamline the report as needed.
Only cancellations that occurred after a previously successful booking are included in this report.
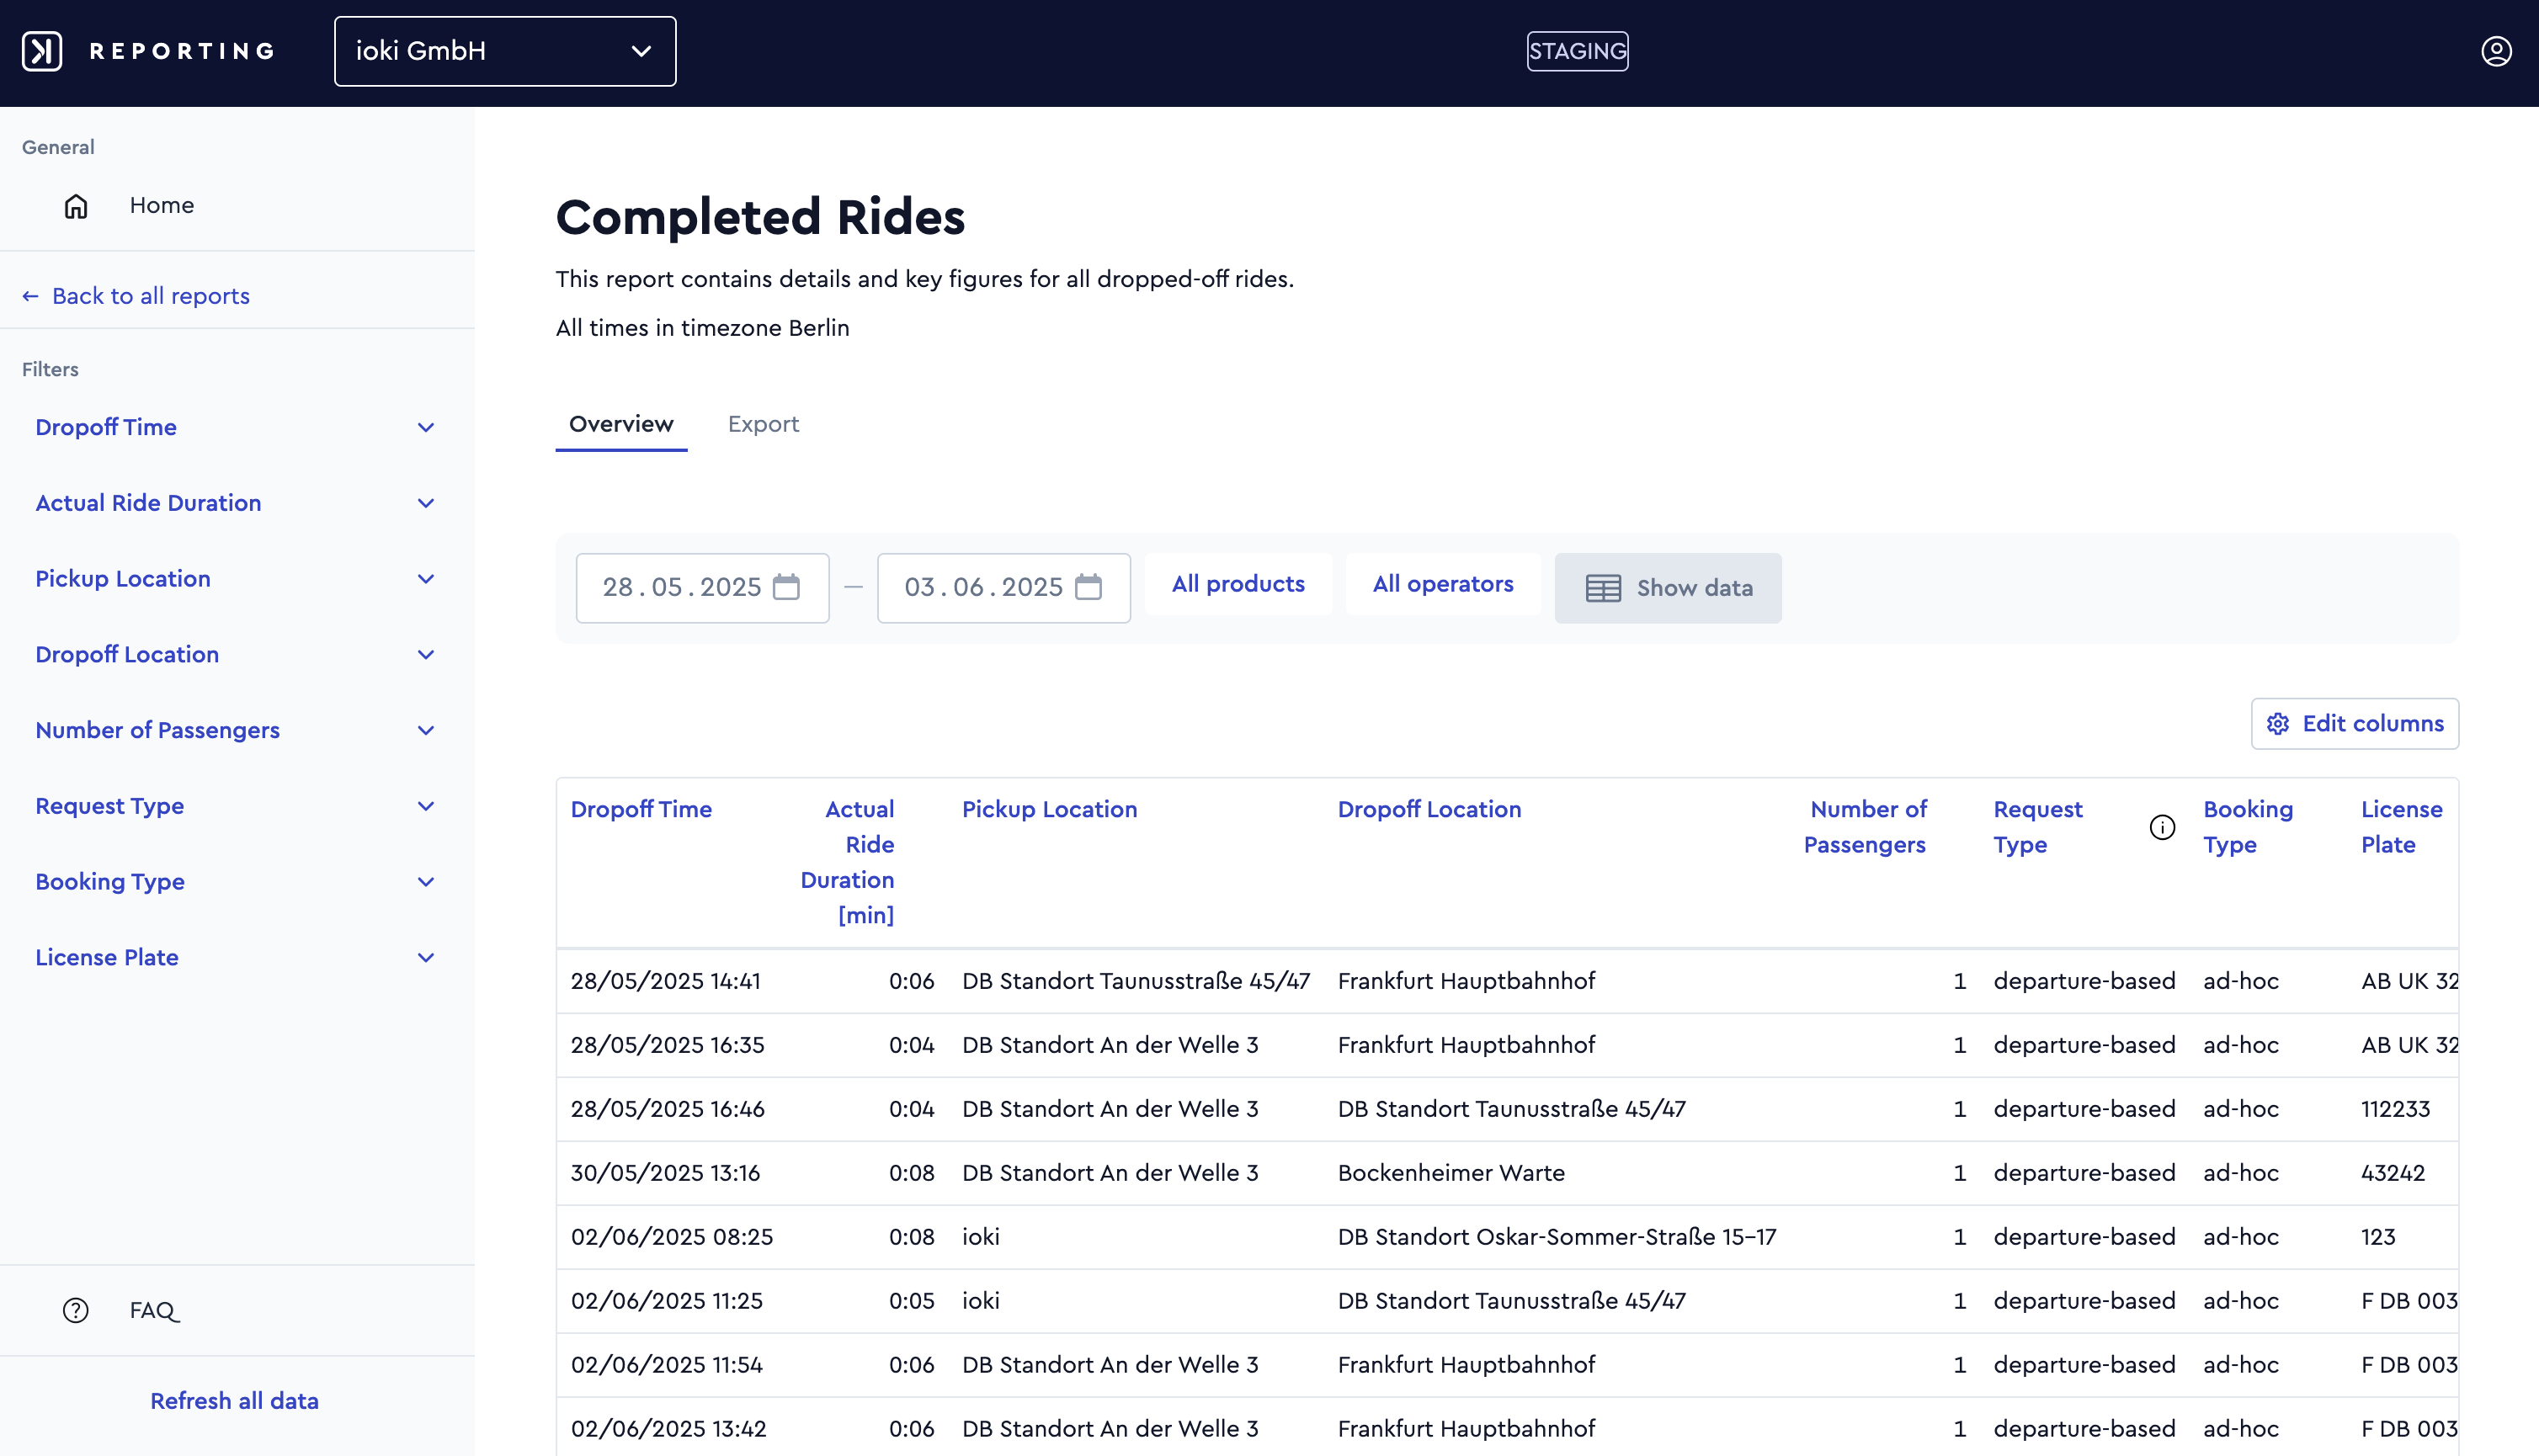
Completed rides
The Completed Rides Report provides comprehensive details and key figures on completed rides, including passenger count, origin and destination, pickup and drop-off, travel times, schedule deviations, booking channel, final fare, and more. A wide range of parameters is available and can be added or removed using the Edit columns option to customize or streamline the report as needed.
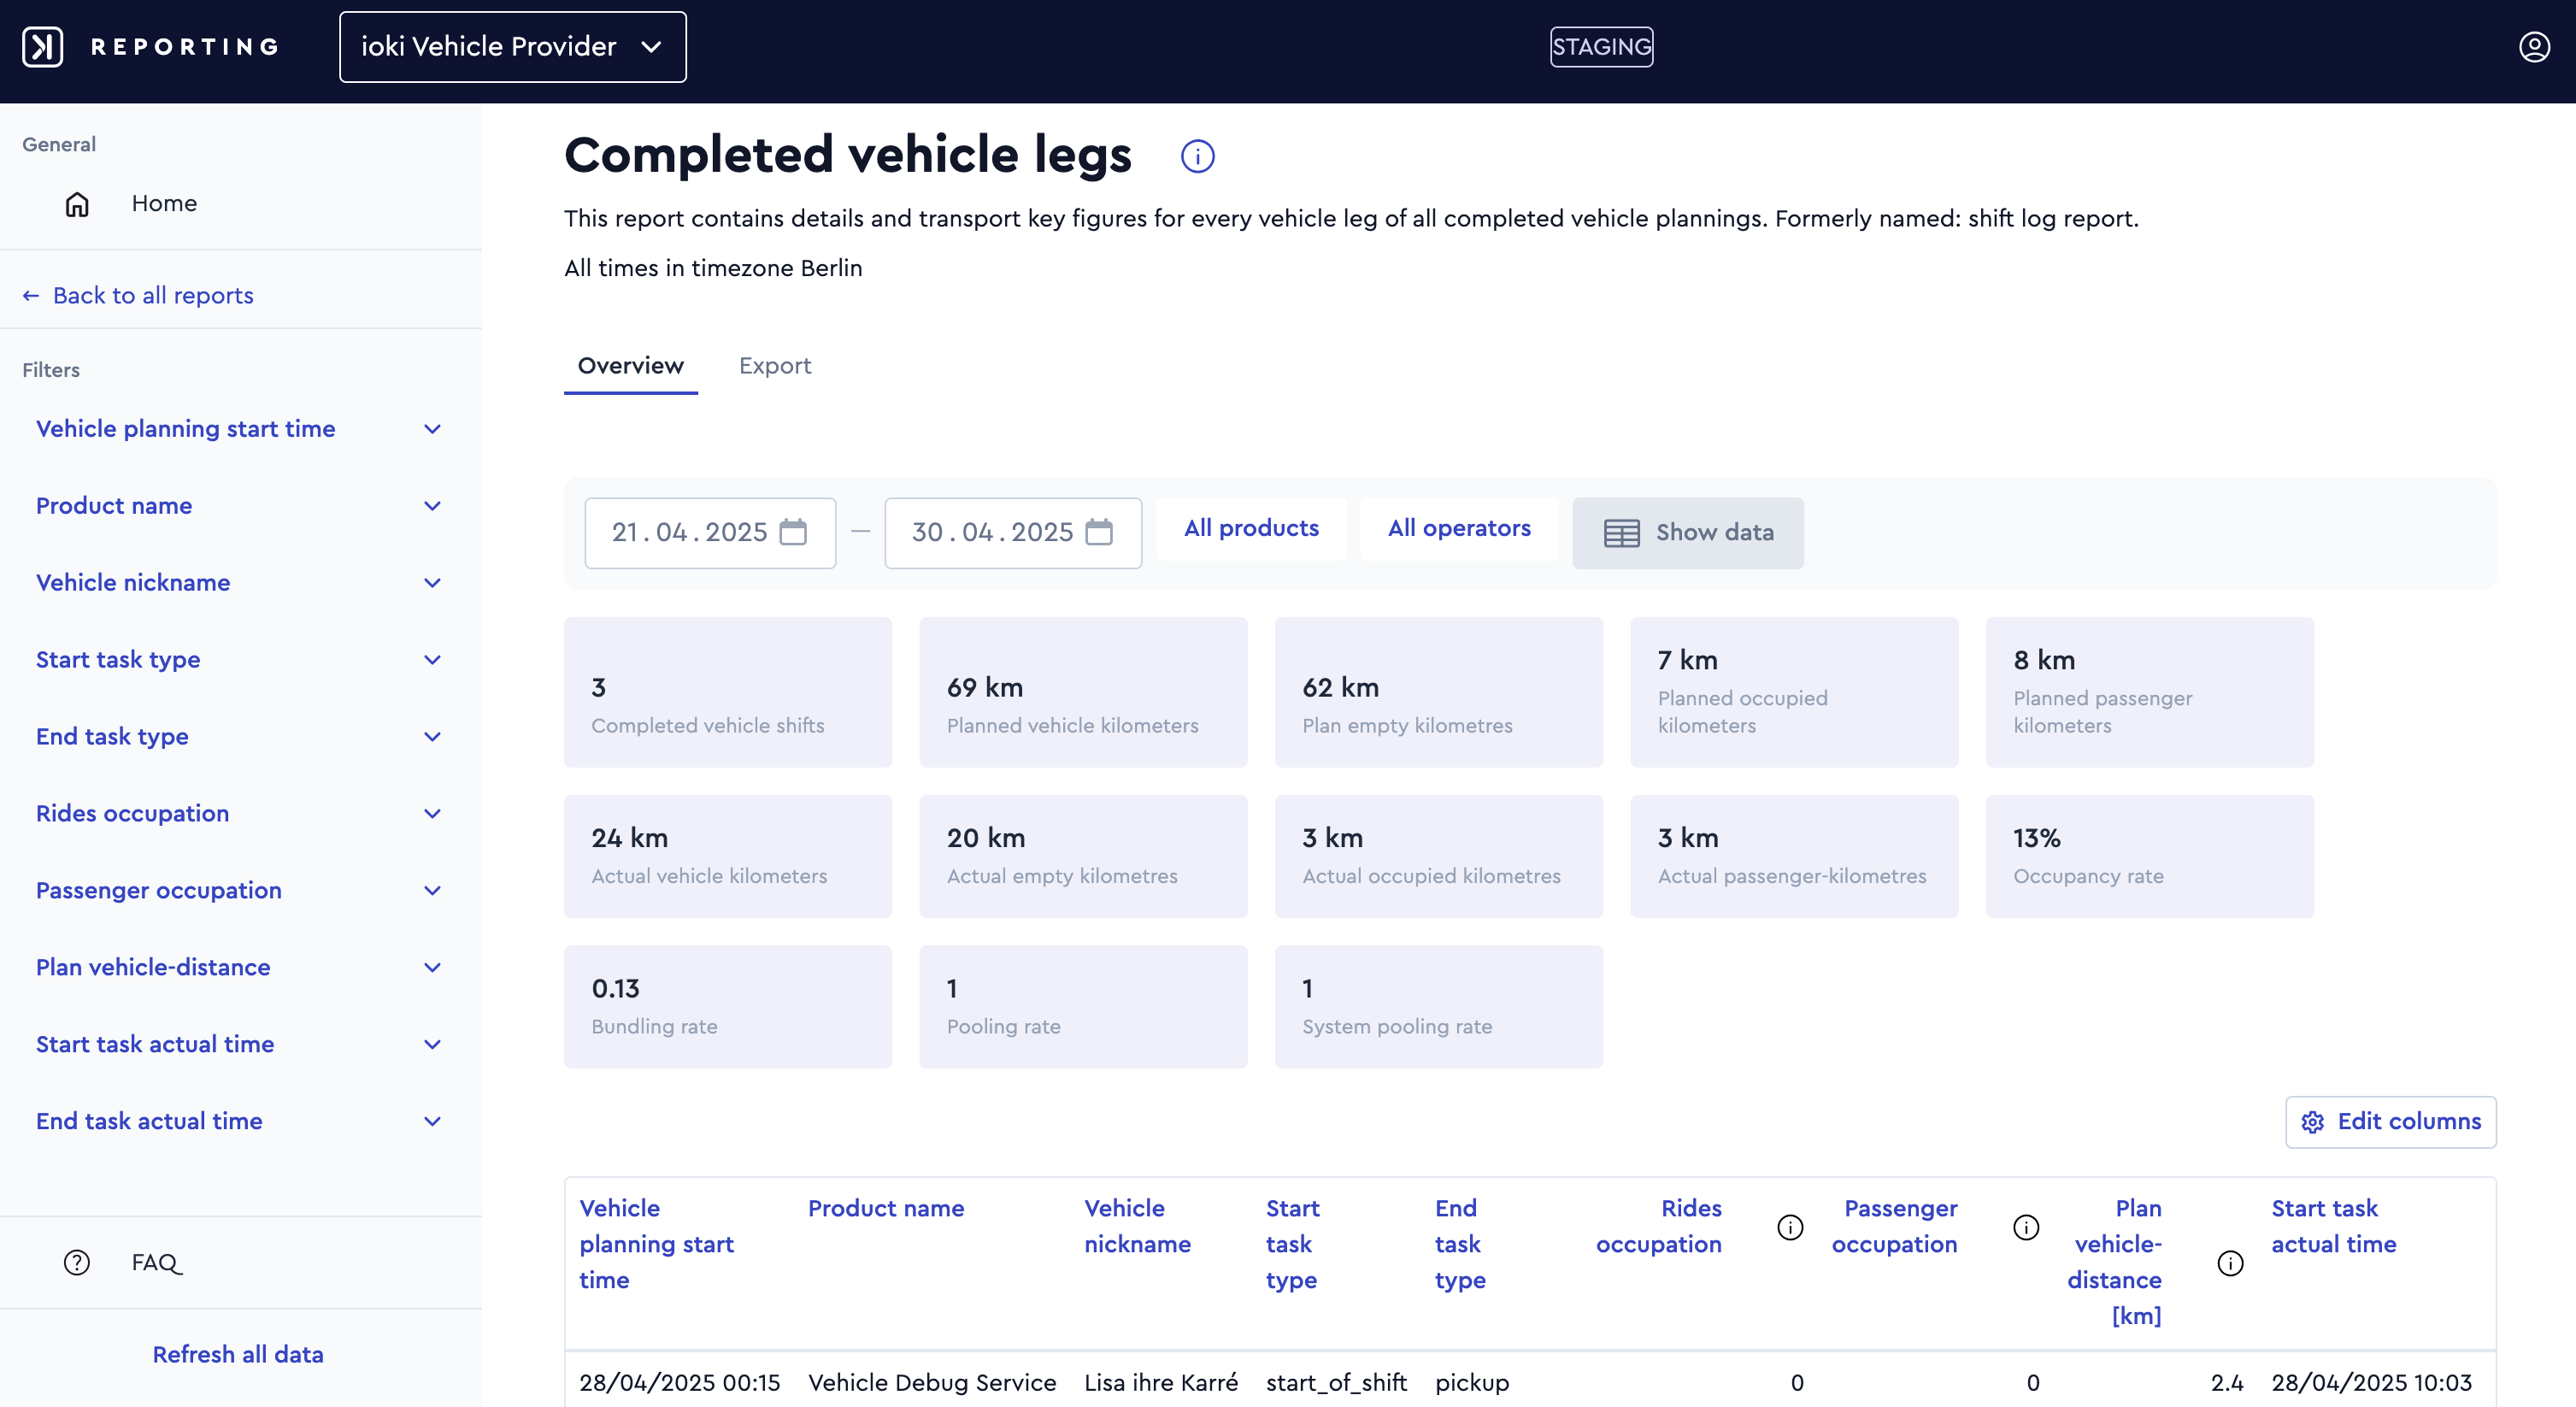
Completed vehicle legs
Formerly known as Shift Log Report, this report provides detailed transport figures for every vehicle leg of all completed vehicle plannings.
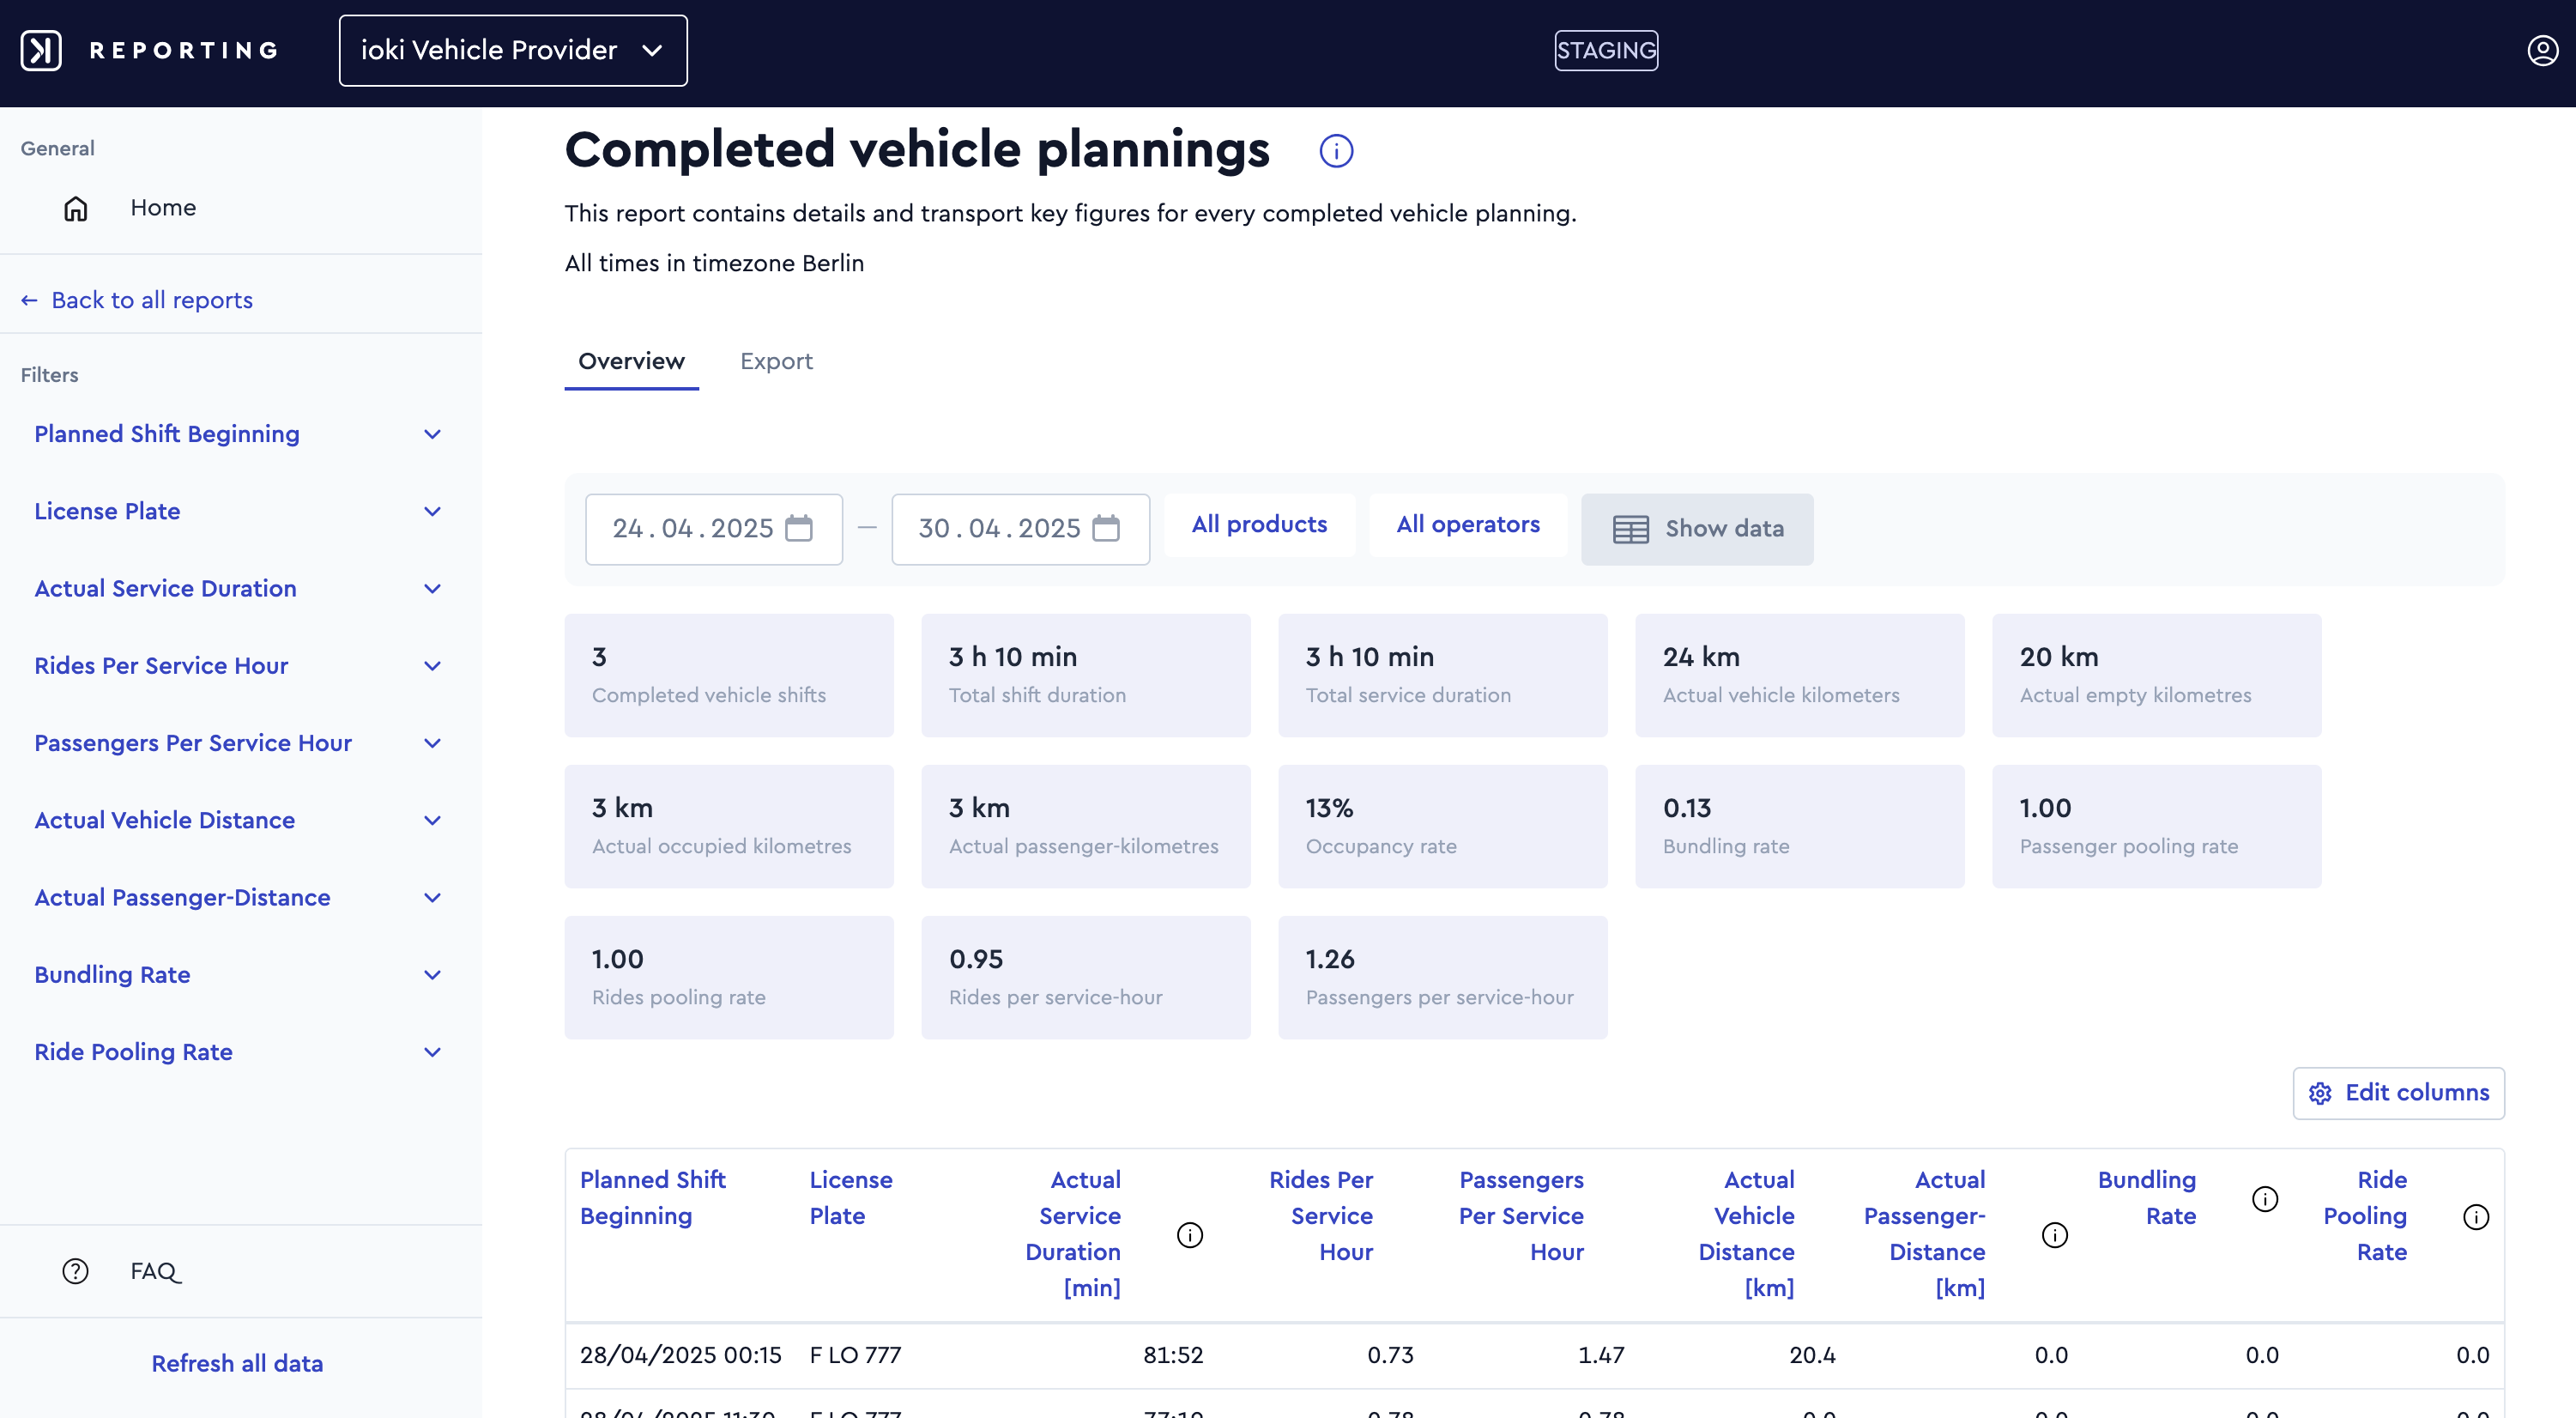
Completed vehicle plannings
The Completed Vehicle Plannings Report provides a condensed summary of key figures from the detailed Completed Vehicle Legs Report (formerly known as the Shift Log), aggregated per vehicle planning. It enables faster and more accessible data analysis when full leg-level detail is not required. In addition to core metrics, the report introduces new insights such as rides and passengers per service hour, as well as duration-based metrics. Vehicle deactivations are also taken into account. This streamlined report is designed for easier interpretation and improved performance.
Passenger and ride options
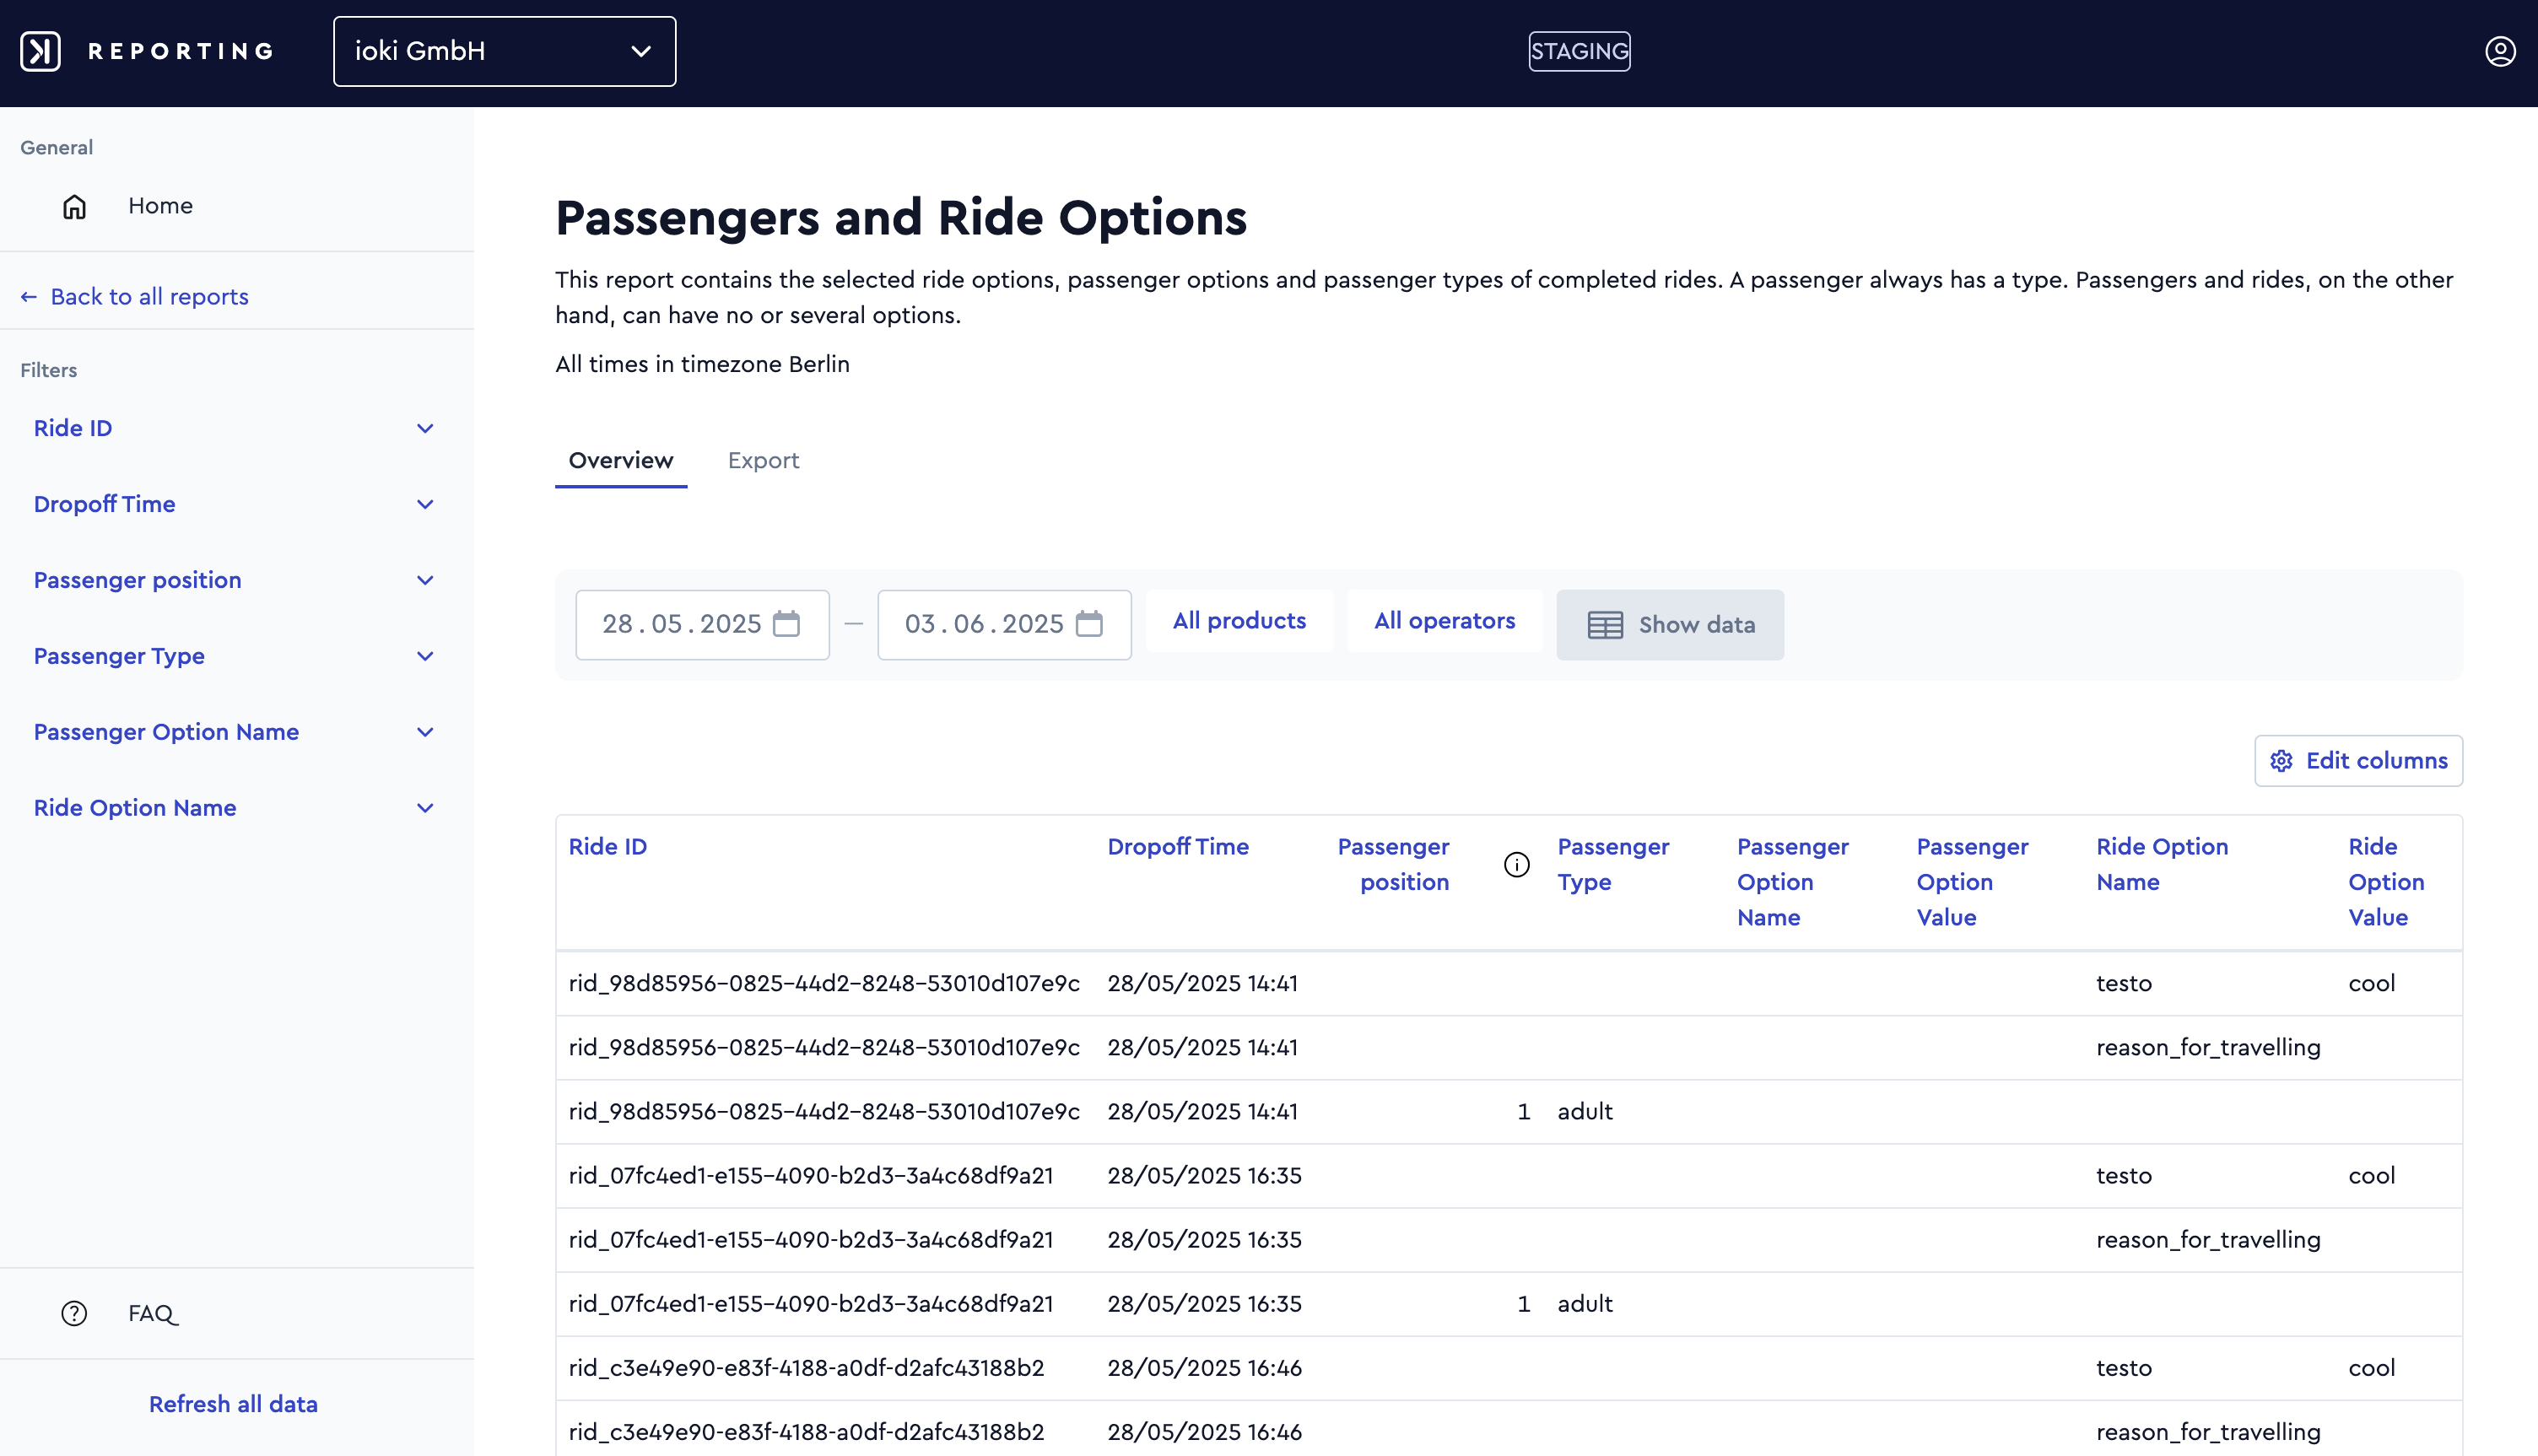
The Passenger and Ride Options Report provides a detailed overview of the selected passenger and ride options as well as passenger types for any completed ride. This report enables in-depth analysis of specific passenger requirements—like the number of wheelchairs transported, infants, dogs, pieces of luggage, and more—providing valuable insights to better understand passenger needs and optimize service planning. A wide range of parameters is available and can be added or removed using the Edit columns option to customize or streamline the report as needed.
Ride ratings
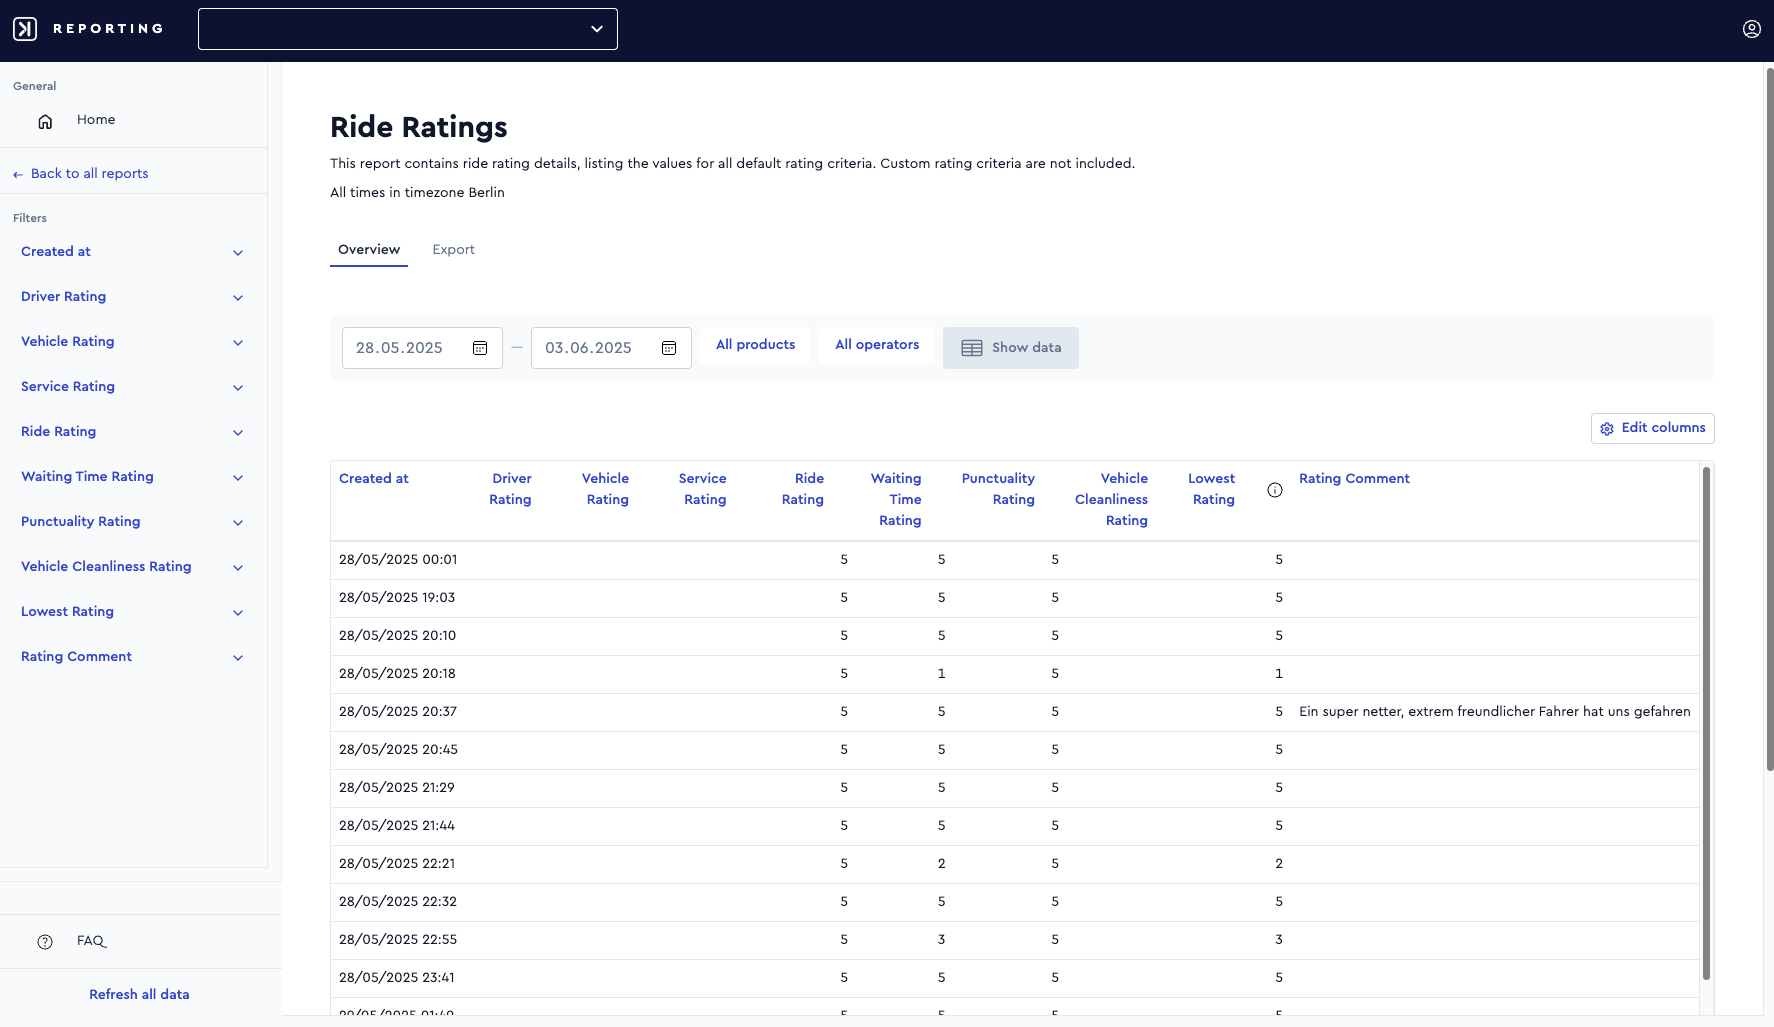
This report contains all user-submitted ride ratings, covering both the three predefined rating categories and any additional free-text feedback. A unified filter makes it easy to identify low-scoring rides based on individual category ratings, enabling quick detection of potential service issues.
Ride requests and booking result
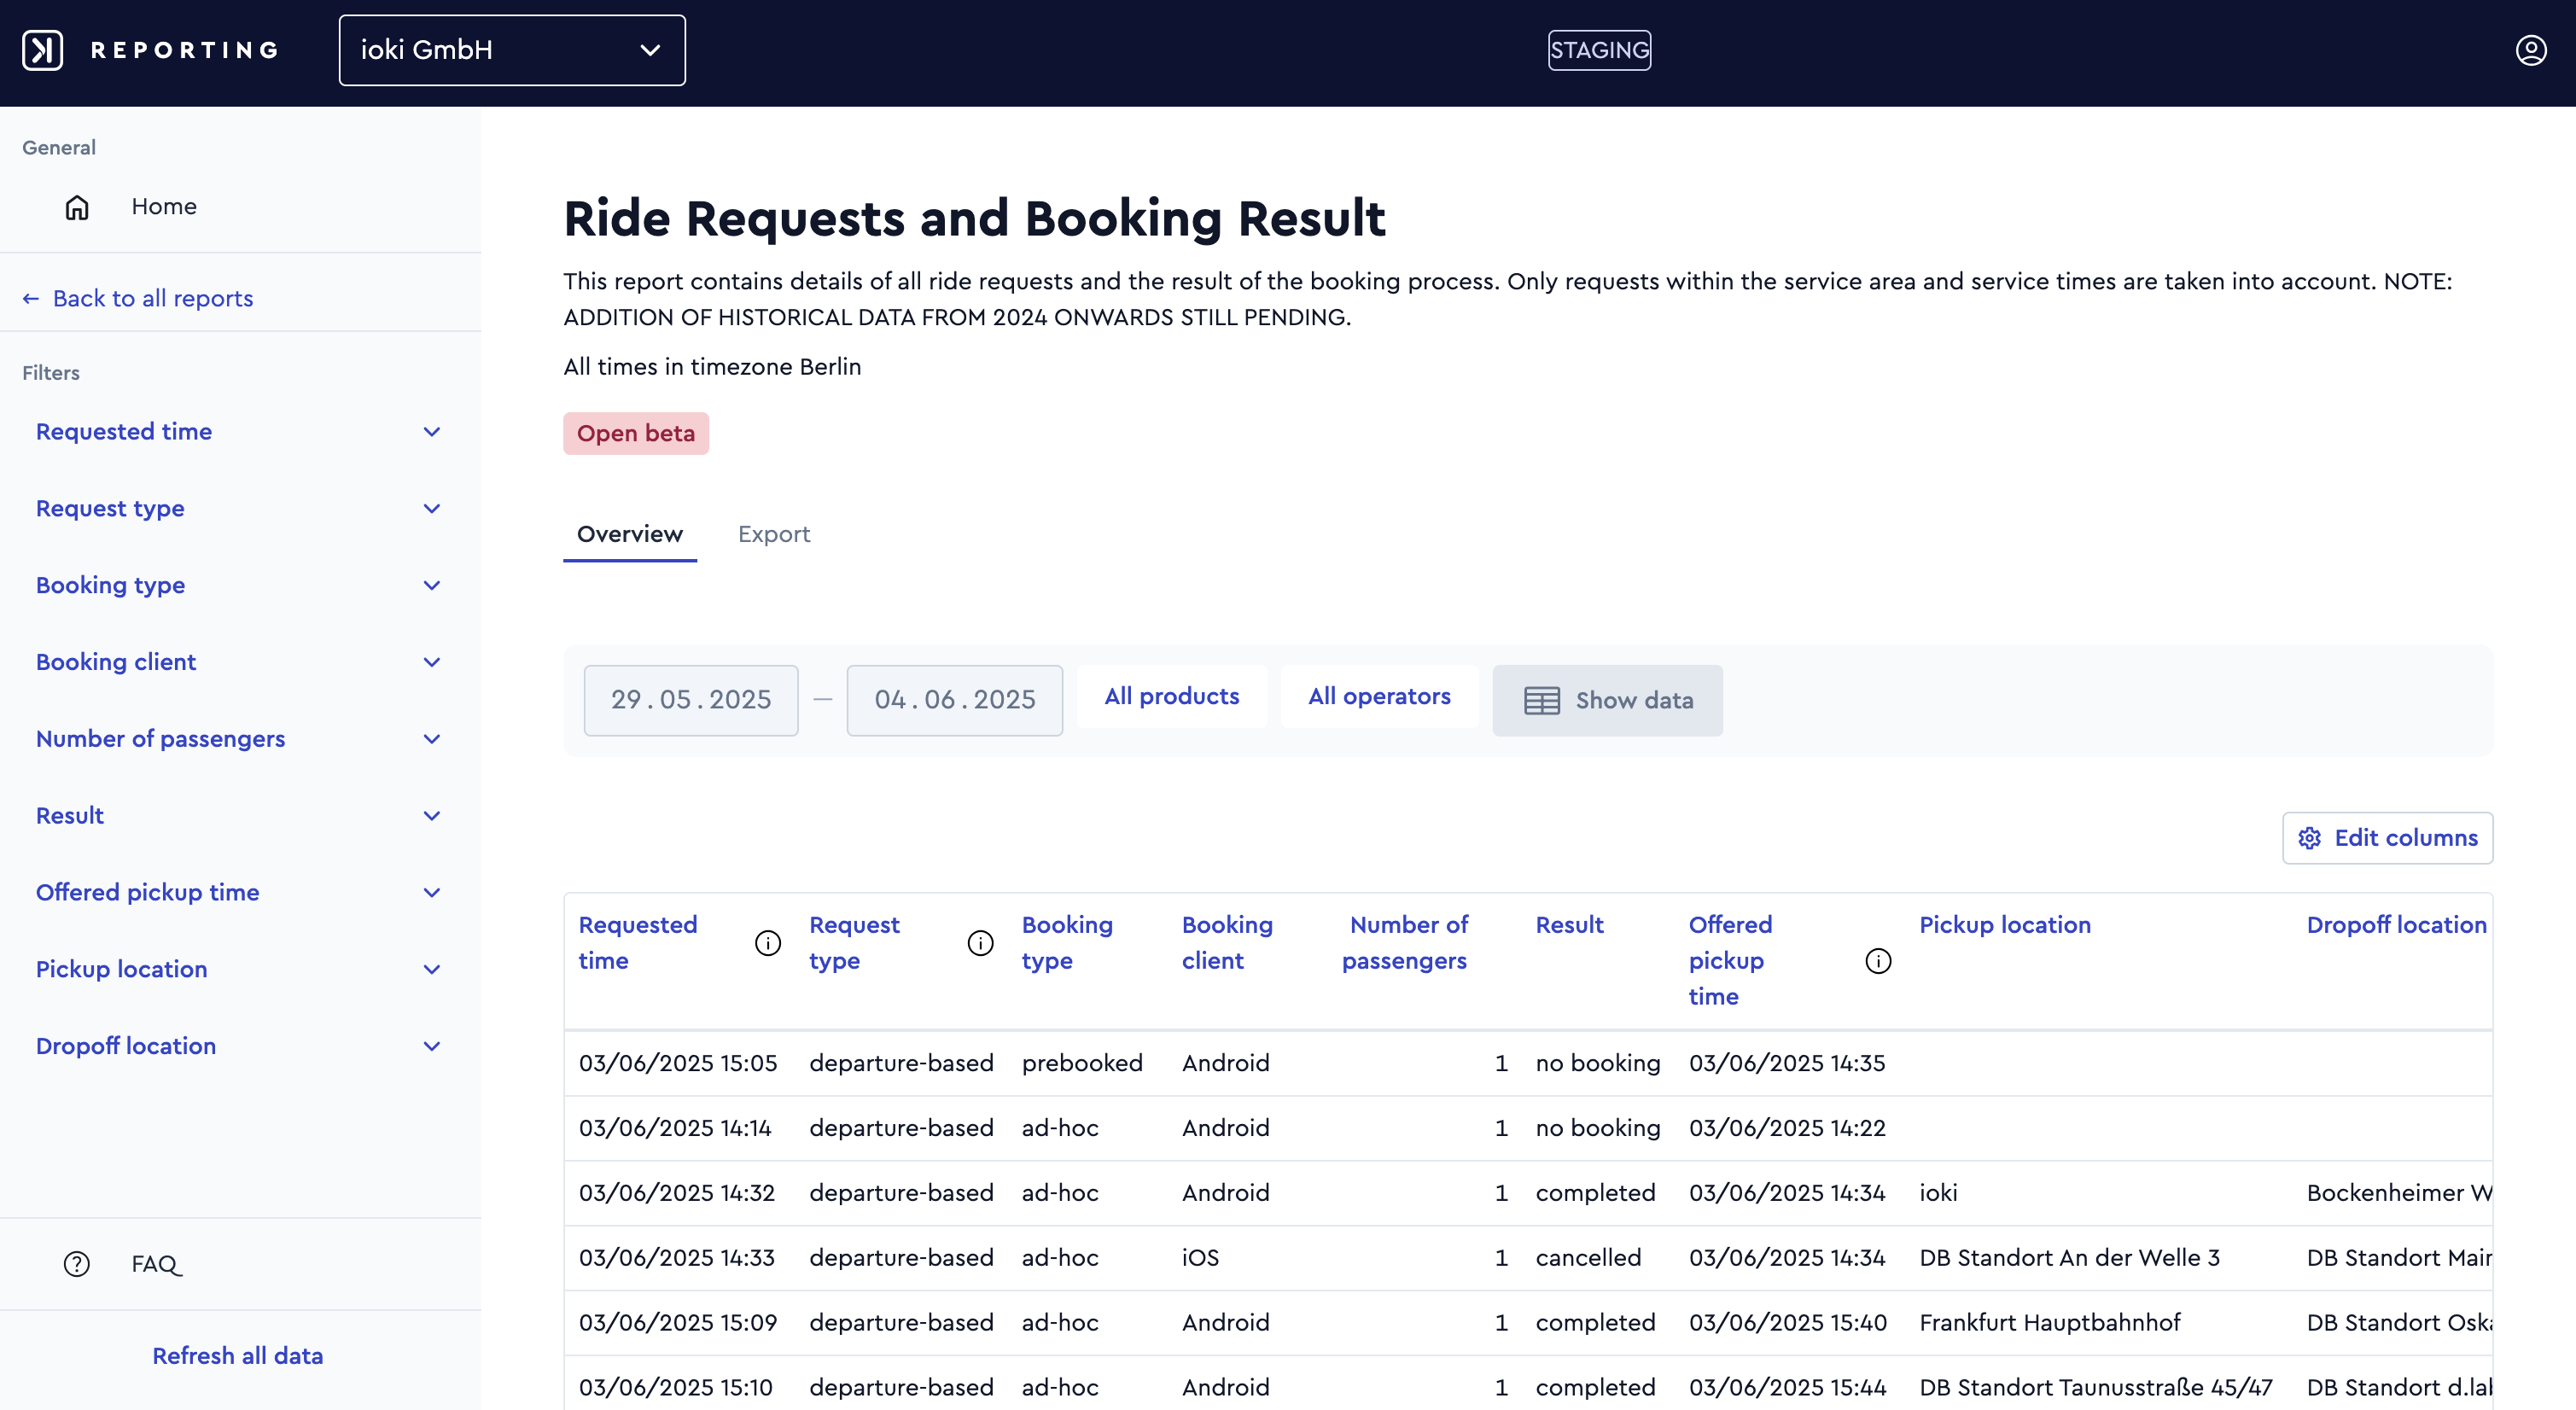
The new Ride Requests and Booking Result report offers a comprehensive view of ride requests and booking paths from multiple angles. It enables in-depth analysis of key performance indicators such as the offer ratio and supports detailed evaluation of the booking funnel, helping providers better understand passenger behavior and system performance.
This report is the direct successor to the former “Ride Requests List” in Tableau. In contrast to the previous version, we’ve significantly enhanced the Booking Result structure by introducing three new booking states to more accurately reflect each stage of the user journey:
- aborted (new) – The passenger or booking agent canceled while the system was still searching for a match
- booking failed (new) – An offer was accepted, but the booking could not be completed
- booked (new) – A new intermediate state representing pre-bookings before they are either canceled or completed
- no offer
- no booking
- canceled
- completed
In addition, several valuable data points have been added to enrich the analysis:
- Booking client type
- Availability/offering of public transport alternatives
- Mode sequence (for intermodal trips)
- Direct routing and walking distance/duration
- Requested vs. offered time
- Delay information
Financial reports
Passenger fares
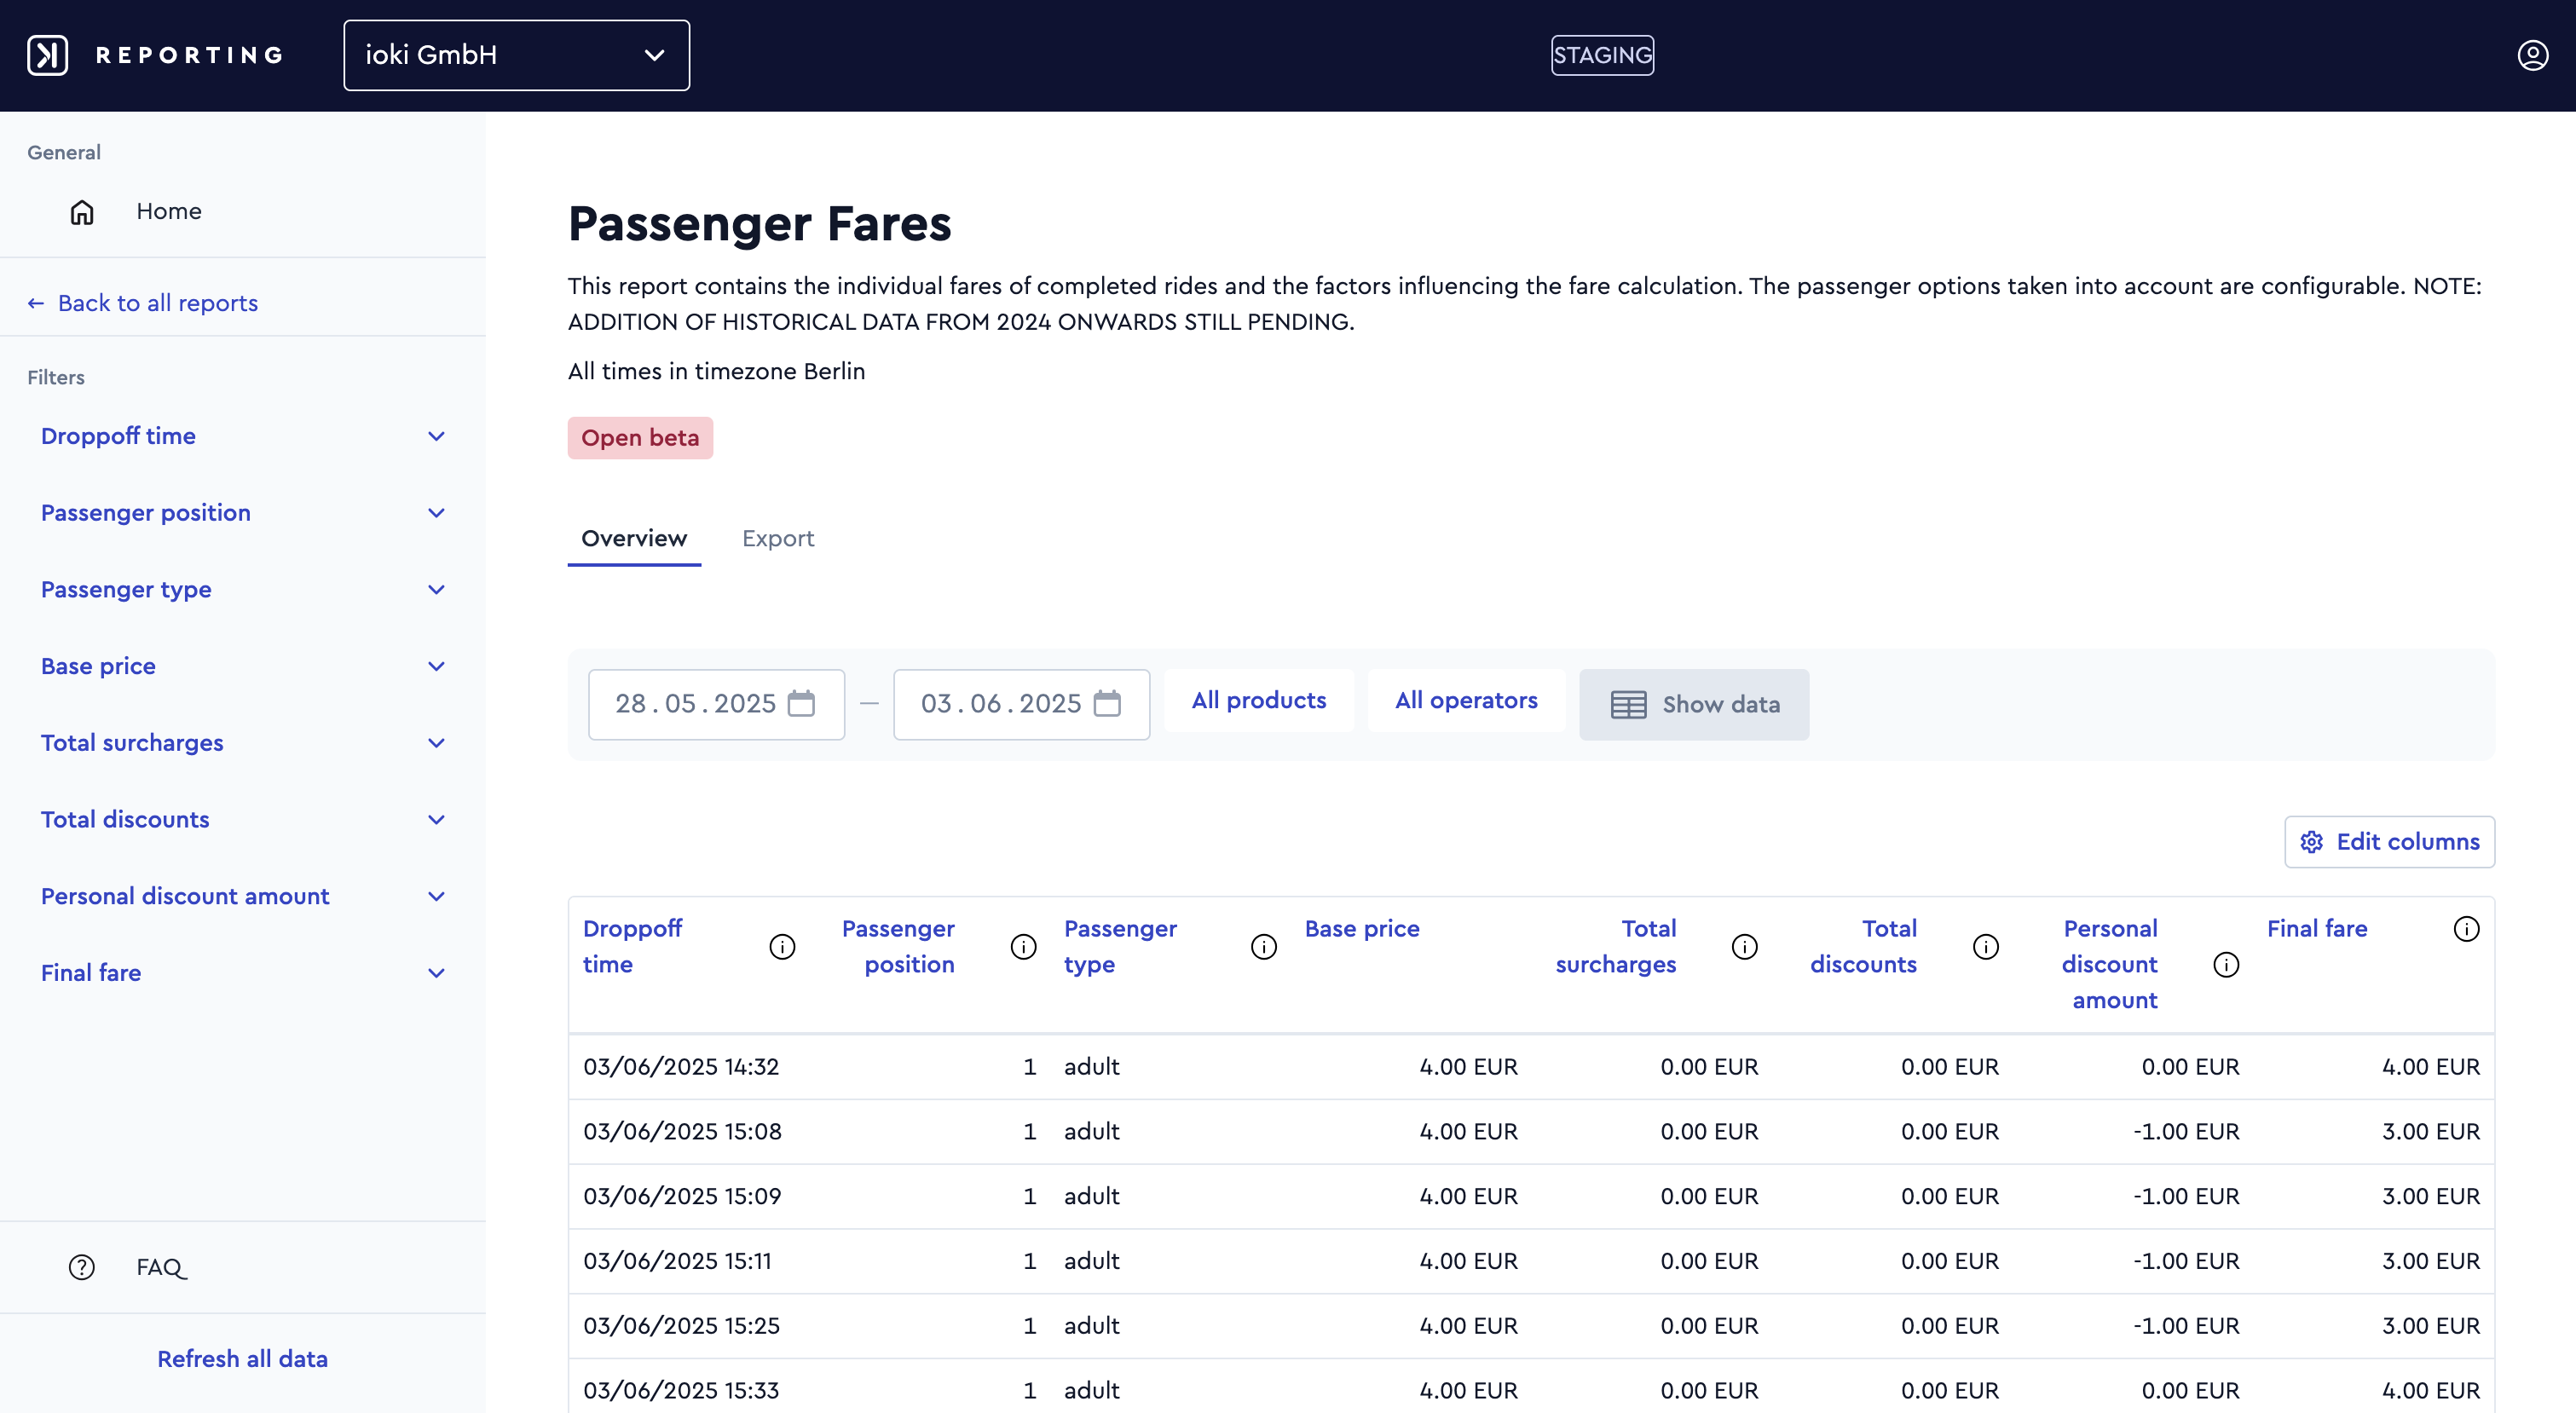
This report shows the individual fares per passenger for completed rides, along with the key factors that influenced fare calculation – such as “Direct-Routing Distance”, fare codes, and selected passenger options. A wide range of parameters is available and can be added or removed using the Edit columns option to customize or streamline the report as needed.
Historical data from 2024 onwards will be added soon and is not yet included in the report.
Payments and refunds
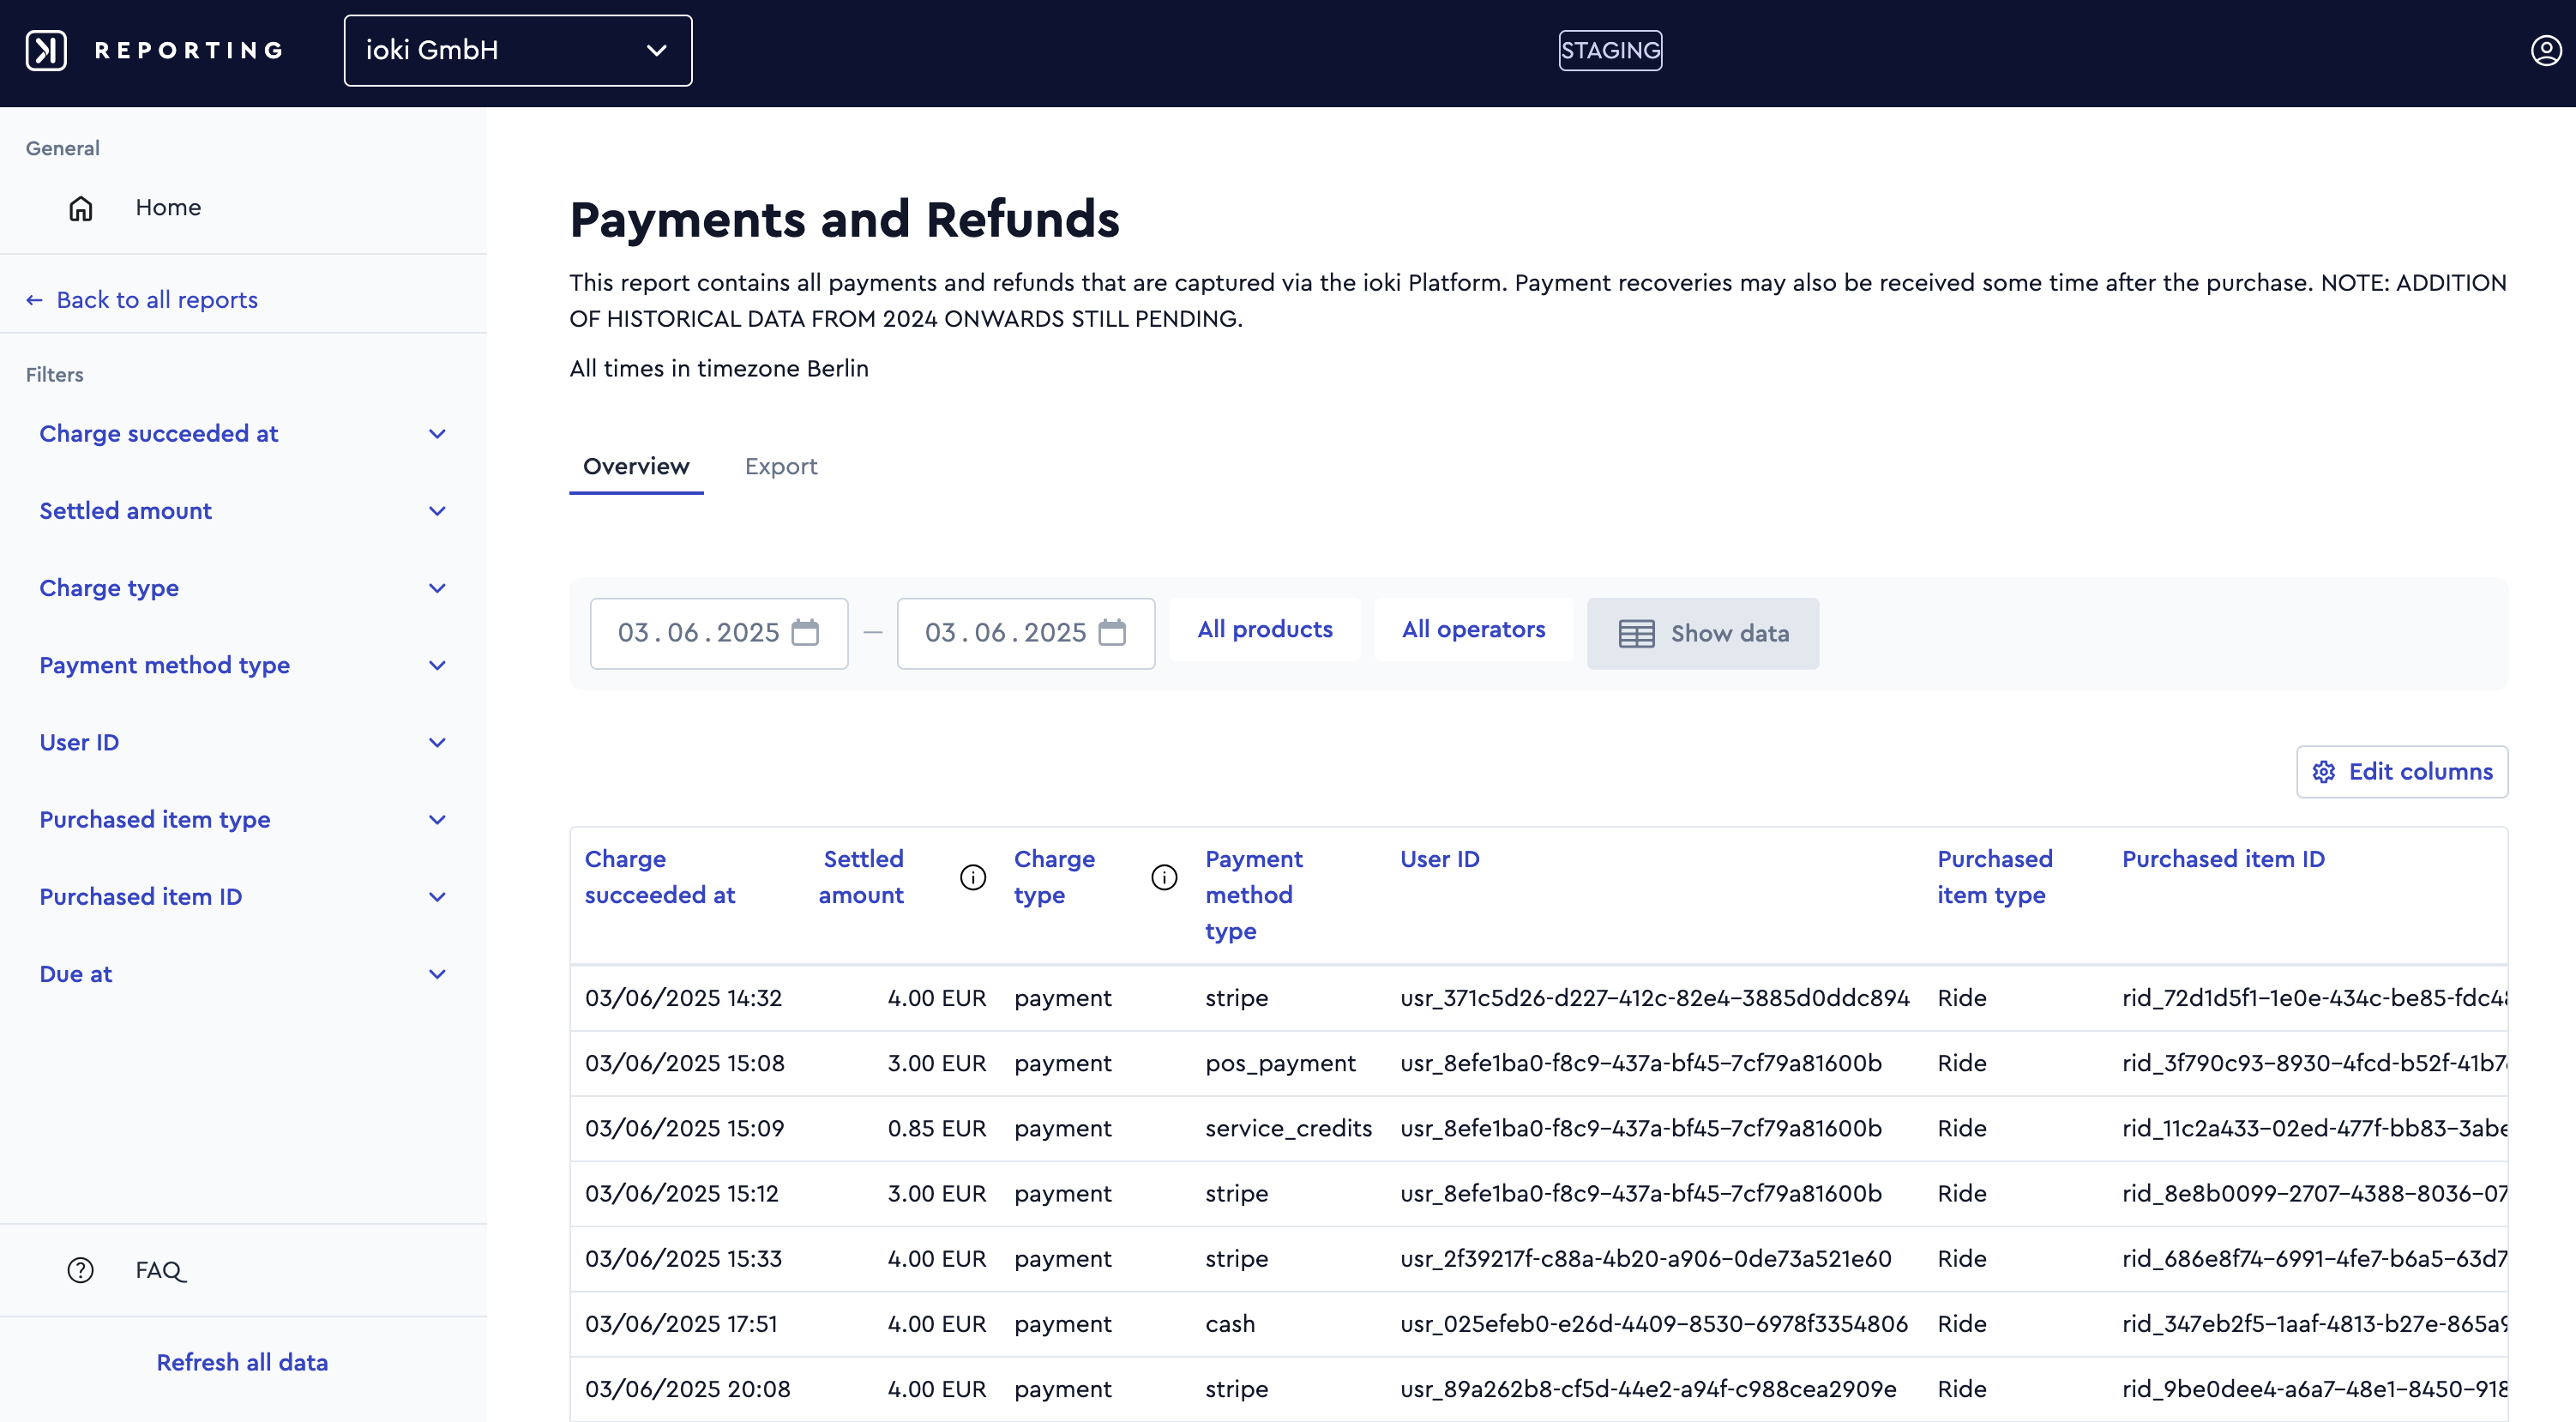
This report includes all payments and refunds processed through the ioki Platform, offering a clear overview of financial transactions. It enables a chronological and transaction-specific recording of all business activities in accordance with proper accounting practices. In addition to fare payments, it also covers all other purchases made via the platform – such as passes, tickets, and more. A wide range of parameters is available and can be added or removed using the Edit columns option to customize or streamline the report as needed.
Historical data from 2024 onwards will be added soon and is not yet included in the report.
Data Bridge
Export of personal user data
A dedicated export of personal data of registered users (passengers) can now be performed via the Data Bridge. This allows relevant information to be provided specifically for marketing or user research purposes.
In contrast to the previous Tableau-based reporting, the new ioki reporting deliberately excluded the display of personal data to minimize data privacy and security risks. The newly available export now enables provider admins to access this sensitive information in a data protection-compliant manner.